<!-- Source PDF SHA-256: e548e4c1a3a207e63e0bc796465997ed215a2350bbe0ad6eecc90c8d3a8442a6 -->

<a id="page-1"></a>

# VizProg: Identifying Misunderstandings By Visualizing Students’ Coding Progress

[Source PDF](https://from.so/assets/pdfs/zhang-vizprog-chi2023.pdf) · [Publisher page](https://doi.org/10.1145/3544548.3581516)

[Ashley Zhang](<https://orcid.org/0000-0001-5978-3714>) University of Michigan Ann Arbor, Michigan, USA gezh@umich.edu

[Yan Chen](<https://orcid.org/0000-0002-1646-6935>) Virginia Tech Blacksburg, Virginia, USA ych@vt.edu

[Steve Oney](<https://orcid.org/0000-0002-5823-1499>) University of Michigan Ann Arbor, Michigan, USA soney@umich.edu

© 2023 Copyright held by the owner/author(s). Publication rights licensed to ACM. ACM ISBN 978-1-4503-9421-5/23/04...$15.00 [https://doi.org/10.1145/3544548.3581516](<https://doi.org/10.1145/3544548.3581516>)

> Permission to make digital or hard copies of all or part of this work for personal or classroom use is granted without fee provided that copies are not made or distributed for profit or commercial advantage and that copies bear this notice and the full citation on the first page. Copyrights for components of this work owned by others than the author(s) must be honored. Abstracting with credit is permitted. To copy otherwise, or republish, to post on servers or to redistribute to lists, requires prior specific permission and/or a fee. Request permissions from permissions@acm.org. CHI ’23, April 23–28, 2023, Hamburg, Germany

## ABSTRACT

Programming instructors often conduct in-class exercises to help them identify students that are falling behind and surface students’ misconceptions. However, as we found in interviews with programming instructors, monitoring students’ progress during exercises is difficult, particularly for large classes. We present VizProg, a system that allows instructors to monitor and inspect students’ coding progress in real-time during in-class exercises. VizProg represents students’ statuses as a 2D Euclidean spatial map that encodes the students’ problem-solving approaches and progress in real-time. VizProg allows instructors to navigate the temporal and structural evolution of students’ code, understand relationships between code, and determine when to provide feedback. A comparison experiment showed that VizProg helped to identify more students’ problems than a baseline system. VizProg also provides richer and more comprehensive information for identifying important student behavior. By managing students’ activities at scale, this work presents a new paradigm for improving the quality of live learning.

## KEYWORDS

programming education at scale, code visualization

## ACM Reference Format:

Ashley Zhang, Yan Chen, and Steve Oney. 2023. VizProg: Identifying Misunderstandings By Visualizing Students’ Coding Progress. In Proceedings of the 2023 CHI Conference on Human Factors in Computing Systems (CHI ’23), April 23–28, 2023, Hamburg, Germany. ACM, New York, NY, USA, [16](<#page-16>) pages. [https://doi.org/10.1145/3544548.3581516](<https://doi.org/10.1145/3544548.3581516>)

## 1 INTRODUCTION

Programming instructors often conduct in-class coding exercises— short programming activities that students perform independently— to give students hands-on practice, assess students’ progress, and identify students that are falling behind. By identifying and working with struggling students, instructors can strengthen students’ understanding of the material and give them a better intuition for important concepts. However, if left unaddressed, small misunderstandings can escalate to become long-term learning barriers for students. Therefore, instructors should be able to identify struggling students and their misunderstandings during in-class exercises promptly and reliably. However, identifying problems in real time is difficult for several reasons. First, misunderstandings tend to be implicit, abstract, and not readily apparent without carefully reading students’ code. However, it is often not possible to read students’ code at scale in large classes or for shorter exercises. Second, there are many aspects of students’ code (including aspects that the instructor might not anticipate) that instructors need to consider to gain insight into potential learning barriers. This suggests that there needs to be a better way to monitor students’ code at scale.

Past research has explored ways to address these challenges. For example, Codeopticon \[[16](<#page-15>)\] allows instructors to monitor students’ code in real-time. However, Codeopticon requires that instructors read students’ code individually, making it difficult to assess students’ performance as a whole, particularly when needing to scale to large classes. Overcode \[[14](<#page-15>)\] addresses the scalability issue by clustering and visualizing student code submissions \[[14](<#page-15>)\]. However, it was designed for post-hoc analyses rather than providing real-time feedback and does not consider the need to monitor students over time. We also found in our interviews with programming instructors that time sensitivity and large class sizes make it difficult for instructors to identify learning challenges during in-lecture exercises. Ideally, instructors should be able to easily identify problems among many students’ coding activities in real-time.

In this paper, we propose new techniques to address these problems and allow instructors to visualize and understand students’ status in real-time for in-class programming exercises. Our design takes inspiration from maps of physical spaces. On a map, if we know a person’s starting point, destination, and location, we can easily determine how close they are to their destination. With real-time updates, we could also determine if they are progressing to their destination or if they might be lost. What if checking where a student is on a programming exercise could be as easy as seeing where they are on a map? Although prior work has represented code in 2-D spaces \[[14](<#page-15>), [19](<#page-15>), [36](<#page-16>)\], our approach is the first to do so in a way that explicitly encodes human-understandable meaning to the space (their problem-solving approach and their progress) and that can work in real-time (as students are typing). This work represents an initial step to show the feasibility and benefits of this approach.

<a id="page-2"></a>

We introduce VizProg, a tool that allows instructors to monitor and inspect large numbers of students’ coding submissions over time by presenting students on a 2D map. In VizProg, students’ status is represented as a position that encodes 1) similarities in students’ code (as 2D Euclidean distances); 2) how students approach the exercise (using vertical space); 3) students’ progress—how close they are to a correct solution (using horizontal space); and 4) how students’ status changes over time. This is done by computing the semantic similarity and edit distance between students’ code and solution code. Additionally, VizProg allows instructors to navigate the temporal and structural evolution of students’ code at different levels of granularity, understand relationships between code, determine when to provide feedback, and assess who might need feedback the most.

We conducted a within-subject experiment to evaluate the effectiveness of VizProg. In a simulated live coding exercise setting, we found that compared to a baseline system, VizProg can help participants to 1) discover more than twice as many student misunderstandings, and 2) find the misunderstandings with less than half of the time and fewer interactions. Furthermore, participants reported that VizProg provides richer and more comprehensive information for identifying important student behaviors. This work can help instructors improve the live learning experience by better understanding students’ mental models and providing tailored feedback at scale. This work makes the following contributions:

- A better understanding of the needs and challenges that instructors have when monitoring students’ in-class coding exercise, based on interviews with programming instructors.

- A novel algorithm for representing students’ progress in coding exercises as a 2D Euclidean spatial map that encodes their approach and progress towards a solution.

- VizProg, a system that builds on this algorithm to facilitate monitoring students’ progress in real-time.

- Evidence showing that VizProg can help identify more misconceptions and important student behaviors in coding exercises than a baseline system.

## 2 RELATED WORK

VizProg is inspired by and primarily contributes to two research fields: programming education at scale, and source code visualization.

### 2.1 Programming Education at Scale

#### 2.1.1 Understanding Students’ Progress.

Prior research has recognized the importance and difficulty of instructors understanding students’ progress in programming exercises. For instance, Markel and Guo examined the step-by-step dynamic of one-on-one tutoring by undergraduate teaching assistants (TA) in a laboratory study \[[23](<#page-15>)\]. Their research suggests that TAs’ greatest difficulty is understanding students’ mental models of course content. Further, early-stage students often have difficulty phrasing their questions clearly and make wrong assumptions about their problems, making it challenging for instructors to understand what they struggle with \[[23](<#page-15>)\]. Wang et al. also conducted interviews with instructors and identified challenges they face when coordinating in-class programming exercises \[[38](<#page-16>)\]. They describe how time and physical constraints make it difficult to observe students’ progress while conducting in-class programming exercises. Due to the lack of understanding of students’ backgrounds, it is also difficult to pair students for discussion by matching those with similar backgrounds. Our interview studies corroborate these findings.

Prior work has also proposed ways to help instructors better understand students’ progress and thought processes. Kim et al. introduce RIMES \[[21](<#page-15>)\], which supports authoring, recording, and reviewing interactive exercises in video lectures to give insights into students’ thought process. RIMES was found to be useful in identifying and helping struggling students, as well as providing qualitative feedback to students \[[21](<#page-15>)\]. Guo developed Codeopticon, an interface that enables instructors to get a real time view of students’ actions by monitoring and chatting with dozens of students \[[16](<#page-15>)\]. However, these tools are limited to small-scale sessions where instructors have the bandwidth to provide one-on-one feedback. VizProg instead proposes using a visualization approach to understand students’ progress at scale. Its visualization is complementary to prior approaches and could be used in combination with them.

#### 2.1.2 Providing Feedback At Scale.

In order to generate feedback that scales to large introductory programming courses while still ensuring feedback is personalized enough to be helpful, instructors need to understand the variation among student solutions and what they struggle with. Markel and Guo discussed the difference between teaching generalizable knowledge and fixing bugs in introductory programming courses \[[23](<#page-15>)\]. Teaching generalizable knowledge requires instructors to understand what knowledge each student comprehends and struggles with.

Researchers developed systems to help instructors understand students’ solutions and provide feedback at scale. Nbgrader helps instructors generate feedback at scale by automatically generating a student version of Jupyter Notebook without solutions and grading assignments using notebooks executing results \[[1](<#page-15>)\]. Overcode and Foobaz use the same clustering pipeline to generate feedback for correct student code solutions at scale \[[13](<#page-15>), [14](<#page-15>)\]. Autostyle uses clustering tools to broadcast actionable hints asynchronously regarding code style as well as the correctness and completeness of code solutions \[[25](<#page-15>)\]. Singh et al. present a feature grammar to capture semantic relationships within programs and a supervised model to grade programming exercises in an independent manner \[[32](<#page-15>)\]. Singh et al. also introduce a system using reference code and potential corrections to errors to automatically provide feedback for introductory programming problems \[[33](<#page-15>)\]. Head et al. proposed MistakeBrowser and FixPropagator to generate feedback for incorrect solutions by clustering the transformation of fixing buggy programs \[[18](<#page-15>)\]. Other research uses crowdsourcing to generate timely, customized feedback at scale. TutorASSIST provides on-demand assistance to students by crowdsourcing from teachers outside the classroom \[[27](<#page-15>)\]. AXIS provides learners with crowd-sourced explanations on how to solve a problem from MTurk and allows learners to revise and evaluate them \[40\].

<a id="page-3"></a>

Most of the works mentioned above are designed to give asynchronous feedback \[[1](<#page-15>), [13](<#page-15>), [14](<#page-15>), [18](<#page-15>), [25](<#page-15>), [33](<#page-15>)\], but have not been applied to real-time feedback generation. PuzzleMe makes it easier for instructors to provide feedback at scale by using peer assessment, where students test and review peer’s solutions \[[38](<#page-16>)\]. Codeopticon helps instructors give students support in real time by watching students editing and debugging and chatting with them \[[16](<#page-15>)\]. However, these tools are not meant to help instructors understand students’ solutions at scale in large classrooms, as VizProg is designed for. Codeopticon shows a list of tiles with every student’s coding process and a chat box, which can be very messy at scale. The process of checking on each student’s status to give feedback is time-consuming for instructors. Moreover, Codeopticon does not support instructors in understanding students’ progress, since instructors focus on directly solving students’ problems. It is challenging for instructors to get a general sense of the whole classroom using these tools. To overcome these problems, we designed VizProg, which visualized students’ progress in a large classroom to help instructors understand issues and provide feedback in real-time.

#### 2.1.3 Artificial Intelligence in Education.

Artificial Intelligence (AI) has an increasingly important role in education \[[5](<#page-15>)\]. Most of these systems aim to complement instructors by helping them scale their capabilities—for example, by producing immediate helpful responses to frequently asked questions \[[15](<#page-15>)\], picking practice problems that are appropriate for a given student \[[7](<#page-15>)\], and allowing instructors to create course-specific intelligent tutoring systems that give students hands-on problem solving guidance \[[39](<#page-16>)\]. VizProg and our algorithms for representing code in 2D maps fit within the larger research area of AI in education. VizProg leverages AI to help instructors make more informed decisions while teaching. By better understanding which students are struggling, how many students are struggling, the problem solving approaches that students take, and the speed of progress, instructors can adapt their in-class exercises to be more responsive to students. For example, they might use this information to decide when to help individual students, to address common issues with the whole class, whether to extend the time given for an exercise, or how to group students into mixed teams for group exercises.

### 2.2 Code Visualization

#### 2.2.1 Two-Dimensional Visualizations of Code.

Prior work has explored ways to visualize code in two-dimensional space. Taniguchi et al. built a system that visualizes mutual edit distances between large groups of code \[[36](<#page-16>)\]. They use these distances to compute high-dimensional vectors for every code sample in a larger set and use T-SNE \[[37](<#page-16>)\] to reduce to two dimensions. There are two key limitations to this approach that VizProg aims to address. First, although there is a clear meaning to the relative positions of two points (closer means smaller edit distance), there is no clear human-understandable meaning for the absolute position of code locations. Thus, it can be difficult to tell if students are making progress. Second, there is no clear way to represent different approaches or the differences between approaches, as there is no semantic information included in the visualization.

Similarly, Huang et al. \[[19](<#page-15>)\] mapped out semantic similarity between students’ submissions in a Massive Open Online Course (MOOC). They used syntactic and functional similarity metrics to create their 2-D maps. However, again, this produces a visualization where there is meaning in the relative positions of code locations but no clear meaning in the absolute positions of code embeddings. Researchers have also used clustering methods to create visualizations of code without 2-D position meaning \[[14](<#page-15>)\]. For instance, OverCode \[[14](<#page-15>)\] visualizes a list of code clusters from correct student solutions, ordering them by cluster sizes. However, visualization without position meaning is insufficient for instructors to track and understand the students’ progress in real-time, such as how students come up with a solution from scratch.

#### 2.2.2 Clustering Submissions.

The high variances in students’ code and its high dimensionality make it difficult to interpret students’ behaviors in a scalable manner. However, clustering students’ code in real time may help reduce the number of submissions that instructors need to manually check. Researchers have explored approaches that combine visualization and clustering techniques to reduce the instructor’s workload and the number of variations they have to handle. The ability to identify and cluster semantically similar submissions in a robust, general manner presents both an opportunity and a challenge. Earlier work clusters code submissions with Abstract Syntax Tree (AST) edit distance in order to evaluate syntax similarity and functional similarity \[[19](<#page-15>)\]. Kaleeswaran et al. analyze data submissions on DP programming exercises by solution strategy, checking how students manipulate arrays in their solution \[[20](<#page-15>)\]. The Codewebs project created a method for quickly determining semantically equivalent code snippets and allowing efficient indexing of all submissions within MOOC programming assignments \[[26](<#page-15>)\]. Overcode uses both static and dynamic analysis to cluster similar, correct code submissions that perform the same computation, and provides a visualization to help instructors understand code solution variation \[[14](<#page-15>)\]. Building on Overcode, Head et al. propose to cluster incorrect code solutions by transformation rather than clustering only correct solutions \[[18](<#page-15>)\]. This helps instructors better understand students’ bugs and create reusable feedback that scales to a large class. Piech et al. introduced a method to encode student programs as embeddings in neural networks and propose feedback generation at scale based on the clusters learned on the embedding space \[28\].

In addition to clustering tools, there is a series of tools that support comparison between programs. File comparison tools like Microsoft Win Diff highlights text that is different between files. Schleimer et al. proposes MOSS for finding similarities among student programs to detect plagiarism \[[31](<#page-15>)\]. Taherkhani et al. use machine learning methods to identify sorting algorithm implementation \[[34](<#page-16>), [35](<#page-16>)\]. With the ability of clustering techniques to support generating feedback at scale, we provide process information that had been overlooked by previous clustering tools to make feedback tailored for students’ problems while simultaneously supporting introductory programming courses at scale.

#### 2.2.3 Real time code sharing.

To support instructors observing students’ progress in programming exercises, one challenge is to maximize the use of information on students’ progress in real time code sharing. Real time code sharing between instructors and students offers many benefits to introductory programming courses. Prior research has shown that real-time code sharing could minimize context switching, facilitates knowledge sharing, lowers both student’s cognitive load and instructor’s teaching load, and improves student engagement in classes \[[3](<#page-15>), [4](<#page-15>), [17](<#page-15>), [38](<#page-16>)\]. Instructors share code in real-time in settings including MOOCs, lecture videos, online livestreams, and real classrooms \[[6](<#page-15>)\]. Real time code sharing facilitates communication between students and instructors. Instructors broadcast programming activities to students, and students share their progress with instructors. Researchers have developed a series of tools to support real time code sharing in educational settings.

<a id="page-4"></a>

For instance, Chen and Guo developed Improv, which synchronizes code and output blocks with slides, therefore minimizing context switching and lowering cognitive load \[[4](<#page-15>)\]. The Codestrates platform integrates code sharing into literate computing for collaboration on computational notebooks \[[29](<#page-15>)\]. Borowski et al. use Codestrates to support real time code sharing among students in computational notebooks \[[2](<#page-15>)\]. Codechella combines automated visualization of running states with real-time code sharing in online educational settings to enable learners to remember, comprehend and apply knowledge \[[17](<#page-15>)\]. PuzzleMe combines peer assessment with real time code sharing where students share test cases and provide timely feedback to their peers, thus helping instructors create engaging introductory programming courses \[[38](<#page-16>)\]. Byun et al. proposed CoCode, a visual program that shows students’ code editors and output in real time to improve student’s social presence for online courses \[[3](<#page-15>)\]. While promising, this work is limited to small scale code sharing. VizProg shares all students’ code at a keystroke level and visualizing them at scale in an easily interpretable way for instructors to analyze students’ behaviors.

## 3 NEEDS AND CHALLENGES IN IN-CLASS CODING EXERCISES

We conducted interviews to better understand how instructors conduct and monitor in-class coding exercises. Our interviews allowed us to better understand how well existing practices and tools work. We recruited six participants (three self-identified as women, three as men) who had taught introductory programming classes in which they conducted in-class coding exercises. The classes the participants taught had more than 150 students. We found our participants through local mailing lists and personal connections. Participants had no prior knowledge of the purpose of the interviews. We asked participants about how they currently conduct in-class coding exercises, how they monitor and understand students’ progress, how they provide feedback, when they move on, and how their future teaching strategies can be influenced by their students’ performance. We summarize our key findings from these interviews as one need and three challenges below.

### 3.1 Need 1 (N1): Need to see students’ coding progress in real-time

Four out of six participants (P1, P2, P4, P5) mentioned the importance of monitoring students’ coding progress during in-class exercises. According to these participants, knowing the progress of the exercise can allow them to gain a more detailed understanding of their students’ knowledge in the specific topics, provide more tailored feedback, and make better decisions regarding the exercise progression (e.g., how much more time to give students to complete their work). “So cannot give like infinite time for them to finish the exam. So if we get, we get a point that even though like no one solved that problem. They’re still thinking, we’ll just stop, try to solve it” (P5). Furthermore, understanding students’ coding progress can help participants get feedback on their own teaching performance, and make plans for the remainder of the class. “it’s important for like time allocation for the rest of the class” (P2). This illustrates how effectively understanding students’ coding progress benefits both instructors and students.

### 3.2 Challenge 1 (C1): Understanding students’ progress at different granularity

Participants reported their strategies for tracking students’ progress both online and in person. For online settings, two participants used ‘breakout rooms’ (smaller virtual meetings that split students into groups) to group students for coding exercises (P1, P2). While conducting the exercises, teaching assistants will monitor the progress of students by jumping between rooms and observing or conversing with them. The instructors will then gather information regarding the performance of the students from these teaching assistants. For in-person settings, two participants stated that they would walk around and monitor individual students’ computers or group discussions (P3, P4). Sometimes they ask students directly about their understanding or check to see if they have any questions. However, many students worry about what their classmates will think if they ask questions or otherwise reveal that they do not understand the material. Thus, our participants found that asking students directly might not be helpful, as students “sometimes pretend to understand to avoid looking ‘stupid’ in front of their peers” (P4). This indicates a need for instructors to monitor students’ progress at various levels (e.g., the individual level, the group level) during in-class activities in an accurate manner.

### 3.3 Challenge 2 (C2): Inability to validate students’ progress at scale

Our participants’ opinions were split when asked how accurate they believe they are at understanding their students’ progress. One third of the participants felt they had a good enough understanding of their students’ progress, even if it was not necessarily very accurate (P1). Other participants are reluctant to claim a good understanding of students’ progress. For example, P2 expressed that they understood “barely anything, I can only tell whether they’re finished or not. \[...\] I cannot observe where they were stuck at.” In light of this, instructors need a means of validating their understandings of student progress at a class scale.

### 3.4 Challenge 3 (C3): Scaling tailored feedback on progress is difficult

More than half of the respondents (4/6) said they sometimes did not have enough time to provide feedback after seeing issues during in-class exercises. “We actually don’t have enough time to make sure everybody completes it” (P1). Typically, participants only had time to provide feedback to a small number of students, which is not scalable. Combining this finding with C2, our participants might also be spending their time with the students who need feedback the most. This indicates that instructors need a quick and efficient means of providing feedback to students as they progress through exercises. Further, it is important that they know who would benefit from feedback the most.

## 4 VIZPROG

### 4.1 System Design Goals

Led by prior work and our interviews with instructors, we developed three design goals (DG1-DG3) to guide the design of VizProg

<a id="page-5"></a>

CHI ’23, April 23–28, 2023, Hamburg, Germany to help instructors monitor students’ in-class exercise progress in real-time.

![Figure 1: VizProg’s User Interface. There are three main view panels: the overall class progress 2D map view (1), a solution-centered view (4), and a progress detailed view (5). On the 2D map view, each dot represents a student’s submission, each line between two dots indicates the edit movement. The x-axis encodes the size of a code edit to be proportional to the distance (2), and the y-axis represents different kinds of solutions for this exercise (3).](https://from.so/assets/markdown/figures/zhang-vizprog-chi2023/figure-001-p005.png)

Figure 1: VizProg’s User Interface. There are three main view panels: the overall class progress 2D map view (1), a solution-centered view (4), and a progress detailed view (5). On the 2D map view, each dot represents a student’s submission, each line between two dots indicates the edit movement. The x-axis encodes the size of a code edit to be proportional to the distance (2), and the y-axis represents different kinds of solutions for this exercise (3).

- DG1: Easily view students’ progress in real-time: The system should provide students’ progress in real-time so that instructors could observe students’ current progress. In the context of in-class programming exercises, the closest we can get to real-time feedback is by providing feedback as students are typing.

- DG2: Easily compare the difference between code. Although participants in our interviews did not raise this issue specifically, we believe instructors would benefit from understanding students’ approaches for solving the problem. This would allow instructors to see which solutions are commonly used, observe if any students solved the problem in an unusual way, and if students are solving the problem using the concepts they learned in class.

- DG3: Ability to inspect and navigate students’ progress at different granularity: Instructors should be able to inspect students’ progress at the level of individuals and as collective groups.

With these design goals in mind, we designed VizProg, a visualization system that allows instructors to navigate the temporal and structural evolution of students’ code, understand relationships between code, and determine when to provide feedback to students. In the following sections, we describe VizProg’s user interface and the algorithms used to realize its features in detail.

### 4.2 VizProg’s User Interface

Figure [1](<#page-5>) shows VizProg’s user interface which consists of three main panels: the overall class progress 2D map view (1), a solution-centered view (4), and a progress detailed view (5). As soon as a user starts VizProg, the system continuously monitors each student’s code editor at a keystroke level. On the 2D map view, it uses a color-coded dot to indicate a student’s code status (correctness) and a gray line to show how their status changes over time (Figure 1.6). As they progress through the coding exercise, the 2D map updates in real-time to always reflect their current status. Instructors can interact with VizProg during the exercise (Figure 1.4, 5) to track class-wide performance or individual progress. Additionally, VizProg provides a lightweight feedback feature that enables users to send text messages to individual students or to a group of students (Fig. 2.d). Below, we describe the user interface design for VizProg.

#### 4.2.1 2D Map View: Overall Class Progress.

<a id="page-6"></a>

To clearly convey when progress is being made—when a student’s position changed (DG1), VizProg depicts progress by left-to-right motion (Fig. 1.1), since rightward movement is a common representation of progress (and there might be a strong psychological basis for this in other domains \[[10](<#page-15>)\]). A gray line was used to connect two consecutive edits. Only when a student submits their code will a dot appear on the 2D map. Small gray dots represent historical code versions (meaning a student submitted that code but has since moved on). Larger dots represent students’ current ‘location’. Orange dots represent students who have not yet found a correct solution (as determined by the instructor’s unit tests). Blue dots represent students who have found a correct solution (Fig. 1.6). We also used a gray rectangle to indicate one type of solution (Fig. 1.3).

![Figure 2: A detailed view of VizProg’s user interface. Instructors can crop a region on the 2-D map to view solutions in that area (a). Cropped regions appear as gray rectangles surrounded by dots (a), and the progress detailed view shows statistics for the region (i, j, k, n). Correct solutions are displayed on the right of the map as blue dots with gray labels (c). When the instructor clicks a student name (f), the 2-D map will highlight this student’s trajectory (b). The solution-centered view consists of statistics related to the solution (e), a list of students’ IDs (f), and correct (g) and incorrect submissions (h) made by these students. Instructors can search for a specific student (d). They can also send feedback to either an individual student or a group of students (d).](https://from.so/assets/markdown/figures/zhang-vizprog-chi2023/figure-002-p006.png)

Figure 2: A detailed view of VizProg’s user interface. Instructors can crop a region on the 2-D map to view solutions in that area (a). Cropped regions appear as gray rectangles surrounded by dots (a), and the progress detailed view shows statistics for the region (i, j, k, n). Correct solutions are displayed on the right of the map as blue dots with gray labels (c). When the instructor clicks a student name (f), the 2-D map will highlight this student’s trajectory (b). The solution-centered view consists of statistics related to the solution (e), a list of students’ IDs (f), and correct (g) and incorrect submissions (h) made by these students. Instructors can search for a specific student (d). They can also send feedback to either an individual student or a group of students (d).

To ensure these updates are done in real-time, VizProg computes locations over intermediate code edits rather than submissions. These edits often include syntax errors, which makes many prior techniques that rely on building Abstract Syntax Trees (ASTs) \[[14](<#page-15>), [26](<#page-15>)\] not feasible to apply. VizProg instead uses transformer-based code vectorization \[[11](<#page-15>)\], which can encode code semantics even when there are syntax errors (as we will describe later). VizProg is designed to make the generated space to continuous and proportional to the size of code edits—the size of a code edit should be proportional to the distance moved in 2-D space (Fig. 1.2). That is, if the Euclidean distance between dot\_a and dot\_b is shorter than that between dot\_b and dot\_c, then student\_a and student\_b should have a more similar solution than that of student\_b and student\_c. In addition, instructors should expect a similar coding pattern when inspecting submissions that are close to each other. In this manner, instructors can identify submissions that are far from being correct.

To help instructors understand the variety of students’ solutions— to identify which solutions might be common and which might be abnormal (DG2), VizProg uses vertical space to represent different kinds of solutions (Fig. 1.3). We applied the same clustering algorithm that we used for individual submissions to display similar solutions vertically closer to each other.

#### 4.2.2 Solution-Centered View: Students End With A Solution.

To inspect the submissions from all the students who arrived at the same solution (DG3), instructors can click a solution (Fig. 1.3) and see the solution-centered view (Fig. 1.4). The list contains three main sections: statistics related to the solution (Fig. 2.e), a list of IDs of students who are close to (or found) this solution (Fig. 2.f), and a list of submissions made by these students (Fig. 2.h). This view also summarizes the number of correct and incorrect submissions that are approaching this solution. The list of student IDs is color coded to represent correctness. The instructor can click each student ID to see the trajectory of the selected student’s submissions on the 2D map view. The progress detailed view also displays all the submission made by this student throughout the history of the exercise (Fig. 1.5).

#### 4.2.3 Progress Detailed View: A Selected Submission(s) View.

<a id="page-7"></a>

To allow users to navigate students’ progress at different granularities, VizProg lets users examine the code progress of both groups and individuals at the code level (DG3). For group progress, instructors can crop a region on the 2D map to see the submissions only within that region (Fig. 2.a). When a region is selected, the area on the map will be a gray rectangle surrounding multiple dots. As long as the selected region has at least one submission, the 2D map view will hide all the dots outside of the region, and the progress detailed view will also display only the selected submission code (Fig. 1.5). To assist users in identifying common misconceptions, VizProg lists these submissions by error type frequency in descending order (Fig. 2.i)[1](<#page-7>). Furthermore, VizProg color codes each submission by its correctness, where orange indicates an incorrect submission and gray indicates a correct submission (Fig. 2.n). VizProg also displays the error message (Fig. 2.j) and highlights the line of code that caused the error when there is an error in the submission (Fig. 2.k). By resizing the overlay or dragging the overlay on the 2D map, the user can view real-time updates on the progress detailed view of the selected region (Fig. 2.a). For individual progress, users can either search by student ID (Fig. 1.5), or click a student ID on the solution-centered view (Fig. 1.4). This student’s progress will also be represented by a trajectory line on the 2D map (Fig. 2.b). After cropping a region or selecting submissions of a student, instructor can use the lightweight feedback feature (Fig. 2.d) to send feedback to the students that are selected.

#### 4.2.4 VizProg visualization compared to alternatives.

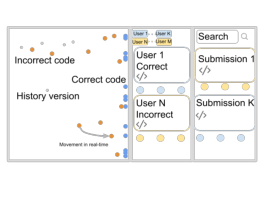
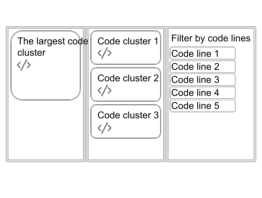
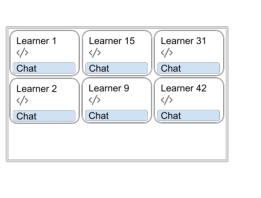
We compare the visualization of VizProg to alternative tools in Table [1.](<#page-8>) We choose OverCode \[[14](<#page-15>)\] and Codeopticon \[[16](<#page-15>)\] as alternatives, which provide the state-of-the-art support for instructors to view students’ solutions in programming courses. The comparison is based on the four aspects listed in Table [1.](<#page-8>) First, VizProg and Codeopticon provide dynamic visualizations that update in real-time for instructors to monitor students’ progress, while OverCode analyzes students’ final solutions that are correct without regard to how they come up with the solutions. Second, the visualization of VizProg and OverCode is more concise than Codeopticon’s. VizProg encodes students’ progress into a 2-D map, where instructors can view hundreds of students’ progress in a single page without scrolling. By displaying clusters of student solutions, OverCode saves space by eliminating solutions with the same computation but different variable names. In Codeopticon, each learner’s progress is summarized in a tile, and the instructors interact with a dashboard consisting of a list of tiles. As a result, Codeopticon is not suitable for large programming courses. Third, VizProg and Codeopticon visualize solutions from all students, while OverCode visualize only solutions that can be executed without syntax errors. Fourth, VizProg summarizes editing history using 2-D trajectories, whereas OverCode and Codeopticon do not. OverCode displays only final submissions. Codeopticon shows code edits as diffs, but does not summarize editing history.

### 4.3 VizProg’s Algorithm

#### 4.3.1 Naïve Approaches.

The easiest approach would be to compute a code vector (using CodeBERT \[[11](<#page-15>)\] or similar tools) and perform dimensionality reduction (using T-SNE \[[37](<#page-16>)\] or similar algorithms) to reduce each code sample to two dimensions that can be displayed to instructors. However, this approach has two important downsides. First, we found that small edits can result in disproportionately large “jumps” in 2-D space by using vector embeddings alone. Second, this approach does not represent data points in a way that are necessarily intuitive; it is difficult to infer whether a student is close to a solution from their position alone.

<sup>1</sup>Failing the unit tests for the problem also produces a runtime error.

Finally, depending on the approach for dimensionality reduction, the lower-dimensional embeddings might need to be re-computed frequently, which is too computationally expensive for real-time updates.

#### 4.3.2 Normalizing Code.

We refer to a given piece of code as 𝑐, a string of characters. 𝑐<sub>𝑠,𝑡</sub> refers to the code of student 𝑠 at time 𝑡. We will use is\_correct(𝑐) ∈ {𝑡𝑟𝑢𝑒, 𝑓 𝑎𝑙𝑠𝑒} to represent if a solution 𝑐 is correct (is\_correct(𝑐) = 𝑡𝑟𝑢𝑒) or incorrect (is\_correct(𝑐) = 𝑓 𝑎𝑙𝑠𝑒), as determined by unit tests. We will use only\_correct(𝐶), where 𝐶 is a set of code samples, to represent the subset of 𝐶 where is\_correct = 𝑡𝑟𝑢𝑒. This means that: only\_correct(𝐶) ⊆ 𝐶.

We rely on two separate similarity metrics to determine how to represent a student with code 𝑐 in VizProg: edit distance and vector similarity (both described below). However, neither of these similarity metrics account for differences that have no functional meaning to the Python interpreter, such as differences in variable names, comments, and spacing. For example, both similarity metrics would determine that the following pieces of code are different, even though they are functionally nearly identical (the only difference being that the code sample on the right prints ‘Done!’):

my\_variable = 10 my\_dictionary = {} for key, value in my\_dictionary.items(): other\_value = value + 1 print(key, other\_value) v = 10 d = {}

# loop over all of the items in d for k, v in d.items():

w = v + 1 # add 1 to the value print(k, w) print('Done!')

Prior work has accounted for this by computing the Abstract Syntax Trees (ASTs) of both samples and modifying variable names between code samples to match \[[14](<#page-15>)\]. However, this approach relies on building an AST, which is typically not possible in the presence of syntax errors. As we discuss above, we designed VizProg to work with code that has syntax errors. VizProg instead relies on text-based normalization, which attempts to normalize code by performing string-level operations, using regular expressions. Our normalization performs the following:

- Removes extra spacing (newline characters, \\n) in the code

- Removes code comments

- Detects variable names, as defined through assignment (e.g., varname = . . . ) or implicit declaration (e.g., for varname in . . . :).

- Removes calls to the print() function, as these are often used by students to debug their code and are not typically part of the problem definition

For example, VizProg’s normalization on the above code samples would produce:

<a id="page-8"></a>

Table 1: We compared the visualization of VizProg to OverCode \[[14](<#page-15>)\] and Codeopticon \[[16](<#page-15>)\] based on four features. A “Dynamic” visualization is one that updates in real-time. “Concise” means that the information can be read in a single page without having to scroll. The term “Represent All” indicates whether it displays all the students in the class. “Summary History” refers to whether history editing is summarized.

<table>
  <thead>
    <tr>
      <th id="pdf-table-863:0-b01741fe-table-8-2-0-0-aecbe731" scope="col" data-pdf-scope="Both">Features</th>
      <th id="pdf-table-863:0-b01741fe-table-8-2-0-1-cc89d57d" scope="col" headers="pdf-table-863:0-b01741fe-table-8-2-0-0-aecbe731">VizProg (this work)</th>
      <th id="pdf-table-863:0-b01741fe-table-8-2-0-2-f05be297" scope="col" headers="pdf-table-863:0-b01741fe-table-8-2-0-0-aecbe731">OverCode [14]</th>
      <th id="pdf-table-863:0-b01741fe-table-8-2-0-3-5883685a" scope="col" headers="pdf-table-863:0-b01741fe-table-8-2-0-0-aecbe731">Codeopticon [16]</th>
    </tr>
  </thead>
  <tbody>
    <tr>
      <td headers="pdf-table-863:0-b01741fe-table-8-2-0-0-aecbe731"></td>
      <td headers="pdf-table-863:0-b01741fe-table-8-2-0-1-cc89d57d"><img src="https://from.so/assets/markdown/figures/zhang-vizprog-chi2023/figure-003-p008.png" alt="VizProg interface sketch: a spatial plot distinguishes correct and incorrect code and earlier versions; adjacent student and submission lists provide code details and search."></td>
      <td headers="pdf-table-863:0-b01741fe-table-8-2-0-2-f05be297"><img src="https://from.so/assets/markdown/figures/zhang-vizprog-chi2023/figure-004-p008.png" alt="OverCode interface sketch: a list of code clusters, the largest cluster, and filters for selected code lines organize students by representative code."></td>
      <td headers="pdf-table-863:0-b01741fe-table-8-2-0-3-5883685a"><img src="https://from.so/assets/markdown/figures/zhang-vizprog-chi2023/figure-005-p008.png" alt="Codeopticon interface sketch: a grid displays six separate learner code panels, each with an individual chat area."></td>
    </tr>
    <tr>
      <th id="pdf-table-863:0-b01741fe-table-8-2-2-0-c504d114" scope="row" headers="pdf-table-863:0-b01741fe-table-8-2-0-0-aecbe731">Dynamic</th>
      <td headers="pdf-table-863:0-b01741fe-table-8-2-0-1-cc89d57d pdf-table-863:0-b01741fe-table-8-2-2-0-c504d114">✓</td>
      <td headers="pdf-table-863:0-b01741fe-table-8-2-0-2-f05be297 pdf-table-863:0-b01741fe-table-8-2-2-0-c504d114">×</td>
      <td headers="pdf-table-863:0-b01741fe-table-8-2-0-3-5883685a pdf-table-863:0-b01741fe-table-8-2-2-0-c504d114">✓</td>
    </tr>
    <tr>
      <th id="pdf-table-863:0-b01741fe-table-8-2-3-0-8e0fe619" scope="row" headers="pdf-table-863:0-b01741fe-table-8-2-0-0-aecbe731">Concise</th>
      <td headers="pdf-table-863:0-b01741fe-table-8-2-0-1-cc89d57d pdf-table-863:0-b01741fe-table-8-2-3-0-8e0fe619">✓</td>
      <td headers="pdf-table-863:0-b01741fe-table-8-2-0-2-f05be297 pdf-table-863:0-b01741fe-table-8-2-3-0-8e0fe619">✓</td>
      <td headers="pdf-table-863:0-b01741fe-table-8-2-0-3-5883685a pdf-table-863:0-b01741fe-table-8-2-3-0-8e0fe619">×</td>
    </tr>
    <tr>
      <th id="pdf-table-863:0-b01741fe-table-8-2-4-0-e82704cc" scope="row" headers="pdf-table-863:0-b01741fe-table-8-2-0-0-aecbe731">Represent All</th>
      <td headers="pdf-table-863:0-b01741fe-table-8-2-0-1-cc89d57d pdf-table-863:0-b01741fe-table-8-2-4-0-e82704cc">✓</td>
      <td headers="pdf-table-863:0-b01741fe-table-8-2-0-2-f05be297 pdf-table-863:0-b01741fe-table-8-2-4-0-e82704cc">×</td>
      <td headers="pdf-table-863:0-b01741fe-table-8-2-0-3-5883685a pdf-table-863:0-b01741fe-table-8-2-4-0-e82704cc">✓</td>
    </tr>
    <tr>
      <th id="pdf-table-863:0-b01741fe-table-8-2-5-0-147f0e68" scope="row" headers="pdf-table-863:0-b01741fe-table-8-2-0-0-aecbe731">Summarize History</th>
      <td headers="pdf-table-863:0-b01741fe-table-8-2-0-1-cc89d57d pdf-table-863:0-b01741fe-table-8-2-5-0-147f0e68">✓</td>
      <td headers="pdf-table-863:0-b01741fe-table-8-2-0-2-f05be297 pdf-table-863:0-b01741fe-table-8-2-5-0-147f0e68">×</td>
      <td headers="pdf-table-863:0-b01741fe-table-8-2-0-3-5883685a pdf-table-863:0-b01741fe-table-8-2-5-0-147f0e68">×</td>
    </tr>
  </tbody>
</table>

v0 = 10 v1 = {} for v2, v3 in v1.items(): v4 = v3 + 1

We refer to the normalized version of code 𝑐 as norm(𝑐). Our normalization method has several drawbacks. First, it could result in small changes producing large semantic changes. For example, if a student 𝑠 as code at time 𝑡 𝑐<sub>𝑠,𝑡</sub> and at time 𝑡 + 1, they add a ‘#’ to comment out some portion of code, the distance between 𝑛𝑜𝑟𝑚(𝑐<sub>𝑠,𝑡</sub>) and 𝑛𝑜𝑟𝑚(𝑐<sub>𝑠,𝑡</sub><sub>+</sub><sub>1</sub>) could be large. Second, there are still several non-functional changes that it does not account for. For example, changing the order of declaration of v0 and v1 in the above code makes no functional difference to the code execution but is not accounted for in our normalization technique. Still, we have found that these issues have a small impact on our underlying algorithm. One of the reasons we used short variable names like v0 is that there is a relatively small cost for naming mistakes; for example, the edit distance between ‘v0’ and ‘v5’ is small. However, future work could further improve our normalization method to account for these challenges.

We divide our discussion into our techniques for determining students’ approach and their progress.

#### 4.3.3 Representing Students’ Problem-Solving Approaches in VizProg.

We represent students’ approach on the y-axis and we use the vector similarity between a students’ solution and existing solutions to determine which approach they are using.

Vector Similarity The first distance metric that VizProg uses is vector similarity. VizProg leverages CodeBERT \[[11](<#page-15>)\], a pre-trained transformer model capable of representing code, to convert code into a vector (with 768 dimensions by default). vec(𝑐) ∈ R<sup>768</sup> represents the vectorized version of code 𝑐, as computed by CodeBERT. We can compute the vector similarity of two different code samples 𝑐<sub>1</sub> and 𝑐<sub>2</sub> using the cosine similarity, after normalizing the code samples (using the normalization technique described above): vec(norm(𝑐 )) · vec(norm(𝑐 ))1 2 vec\_sim(𝑐 ,𝑐 ) ≔1 2 \| vec(norm(𝑐 ))\|\| vec(norm(𝑐 ))\|1 2

This produces a single number in the range \[−1, 1\] where higher numbers represent higher similarity. In practice, this vector similarity tends to be very close to 1 when comparing code samples for the same exercise, even when comparing different approaches to the same problem (empirically, in the range \[0.96, 1.0\]).

Building a Solution Space In order to build a Euclidean space for code solutions to a given problem, VizProg first needs a pre-existing set of prior solutions. In practice, these prior solutions might come from previous class sessions, previous semesters, instructor-written solutions, or could be collected after some subset of students has completed the exercise. The source of prior solutions may affect the solution space. Ideally, solution sets should be seeded from a source that contains a diverse and comprehensive set of approaches to solving the problem. We will discuss the problem of seeding VizProg in more detail in section [4.3.6.](<#page-9>) We denote the set of prior solutions as PAST\_CODE = {𝑝<sub>1</sub>, 𝑝<sub>2</sub>, · · · , 𝑝<sub>𝑛</sub><sub>𝑝𝑎𝑠𝑡</sub> }, where there are 𝑛 prior code examples. Ideally, PAST\_CODE should contain𝑝𝑎𝑠𝑡 several examples of correct solutions (is\_correct(𝑝) = 𝑡𝑟𝑢𝑒 for some 𝑝 ∈ PAST\_CODE) but typically should contain a mixture of correct and incorrect solutions.

We first build a matrix 𝑃 containing the vector representation of every item 𝑝<sub>𝑛</sub> in PAST\_CODE (after normalizing the code):

![P is the matrix of code vectors vec of norm of p sub 1 through vec of norm of p sub n past. P belongs to the real matrices of size n past by 768.](https://from.so/assets/markdown/figures/zhang-vizprog-chi2023/formula-001-p008.png)

**Formula:** P is the matrix of code vectors vec of norm of p sub 1 through vec of norm of p sub n past. P belongs to the real matrices of size n past by 768.

<a id="page-9"></a>

We then reduce 𝑃 from 768 rows to 1 row, first using Principal Component Analysis (PCA) (to reduce from (𝑛<sub>𝑝𝑎𝑠𝑡</sub> ×768) to (𝑛<sub>𝑝𝑎𝑠𝑡</sub> × 40)) and then T-SNE \[[37](<#page-16>)\] (to reduce from (𝑛 × 40) to (𝑛 × 1)).𝑝𝑎𝑠𝑡 𝑝𝑎𝑠𝑡 This reduces 𝑃 to a single vector, which we call ⃗𝑦 =T-SNE(PCA(𝑃, 40), 1) ∈ R<sup>𝑛</sup><sup>𝑝𝑎𝑠𝑡</sup> , because we will use it to compute the vertical (y) position of students’ code. ⃗𝑦 ∈ R denotes the position of prior𝑝 code sample 𝑝. We go through this process in order to distinguish between solutions 𝑝<sub>𝑖</sub> and 𝑝 that are very similar (𝑦 ⃗<sub>𝑖</sub> ≈ 𝑦⃗<sub>𝑗</sub> ) or𝑗 𝑝 𝑝 different (𝑦 ⃗ ≉ 𝑦⃗ ).𝑝 𝑝𝑖 𝑗

In addition, we use OverCode \[[14](<#page-15>)\] to cluster similar correct solutions from PAST\_CODE more robustly. A cluster in OverCode \[[14](<#page-15>)\] is a set of correct solutions that perform the same computation. For a given problem, we get distinct solution clusters, which we use to label correct solutions along the y-axis in VizProg (Fig. 1.3). Encoding Approach To determine which approach students are attempting to use, we use the vector similarity between students’ solutions and prior solutions (all after normalizing the code). For a student’s code 𝑐 we first select the 𝑛<sub>𝑣𝑒𝑐</sub><sub>\_</sub><sub>𝑠𝑖𝑚</sub> prior solutions in PAST\_CODE that are correct and most similar to 𝑐 and store the result in NEAR\_APPROACH. Formally, this is:

![NEAR\_APPROACH of c is the subset PC of correct past code, with n vec sim elements, that maximizes the sum over p in PC of vec\_sim of c and p.](https://from.so/assets/markdown/figures/zhang-vizprog-chi2023/formula-002-p009.png)

**Formula:** NEAR\_APPROACH of c is the subset PC of correct past code, with n vec sim elements, that maximizes the sum over p in PC of vec\_sim of c and p.

In Python code, this could be computed as (assuming c is defined as the current code sample):

NEAR\_APPROACH = sorted(filter(is\_correct, PAST\_CODE), key=lambda p: vec\_sim(c, p))\[𝑛<sub>𝑣𝑒𝑐</sub><sub>\_</sub><sub>𝑠𝑖𝑚</sub>:\]

This produces the subset of PAST\_CODE with most semantically similar correct solutions. Smaller values of 𝑛<sub>𝑣𝑒𝑐</sub><sub>\_</sub><sub>𝑠𝑖𝑚</sub> produce movement that better reflects the solution that a given code sample is closest to but it can result in frequent vertical jumps as the closest solution changes. Larger values of 𝑛<sub>𝑣𝑒𝑐</sub><sub>\_</sub><sub>𝑠𝑖𝑚</sub> produce movement over time that is smoother but can be less accurate. VizProg uses 𝑛 = 10.𝑣𝑒𝑐\_𝑠𝑖𝑚

We then compute the y position of code𝑐 as the weighted average of these similar solutions:

![y\_position of c equals the sum over p sub n in NEAR\_APPROACH of c of y tilde sub n multiplied by the softmax weight of vec\_sim of c and p sub n cubed.](https://from.so/assets/markdown/figures/zhang-vizprog-chi2023/formula-003-p009.png)

**Formula:** y\_position of c equals the sum over p sub n in NEAR\_APPROACH of c of y tilde sub n multiplied by the softmax weight of vec\_sim of c and p sub n cubed.

Where ⃗𝑦<sub>𝑛</sub> ∈ R represents the y position of code 𝑛 (as computed above). We cube the vector similarity to better differentiate between several similarities that are close to 1, while preserving the sign of the vector similarity.

#### 4.3.4 Representing Students’ Progress in VizProg.

The second distance metric that VizProg uses is edit distance. We represent students’ progress on the x-axis and we use the edit distance to determine how far they are from a correct solution. Computing Edit Distance We use the normalized Levenshtein edit distance \[[22](<#page-15>)\] (‘levenshtein(𝑎,𝑏)’ denotes the distance between 𝑎 and 𝑏) to determine the edit distance between code samples:

![edit\_distance of c sub 1 and c sub 2 equals the Levenshtein distance between norm of c sub 1 and norm of c sub 2, divided by the larger length of those two normalized code strings.](https://from.so/assets/markdown/figures/zhang-vizprog-chi2023/formula-004-p009.png)

**Formula:** edit\_distance of c sub 1 and c sub 2 equals the Levenshtein distance between norm of c sub 1 and norm of c sub 2, divided by the larger length of those two normalized code strings.

where len(𝑐) represents the number of characters in 𝑐 (a positive integer ∈ N) and max(𝑎,𝑏) represents 𝑎 if 𝑎 ≥ 𝑏 and 𝑏 otherwise. We normalize (divide by the maximum length code sequence) in order to avoid disproportionately long or short solutions or submission from overly influencing the edit distance. Thus, edit\_distance(𝑐<sub>1</sub>,𝑐<sub>2</sub>) always returns a positive number between

\[0, 1\] where 0 would mean 𝑐<sub>1</sub> and 𝑐<sub>2</sub> are functionally identical (small edit distance).

Encoding Progress To determine how close students are to a correct solution, we use the edit distance between students’ solutions and prior solutions (all after normalizing the code). We first find the 𝑛<sub>𝑒𝑑𝑖𝑡</sub><sub>\_</sub><sub>𝑠𝑖𝑚</sub> closest solutions by edit distance. VizProg uses 𝑛 = 10. Formally:𝑒𝑑𝑖𝑡\_𝑠𝑖𝑚

![NEAR\_EDIT of c is the subset PC of correct past code, with n edit sim elements, that minimizes the sum over p in PC of edit\_distance of c and p.](https://from.so/assets/markdown/figures/zhang-vizprog-chi2023/formula-005-p009.png)

**Formula:** NEAR\_EDIT of c is the subset PC of correct past code, with n edit sim elements, that minimizes the sum over p in PC of edit\_distance of c and p.

In Python code, this could be computed as (assuming c is defined as the current code sample):

NEAR\_EDIT = sorted(filter(is\_correct, PAST\_CODE), key=lambda p: edit\_distance(c, p))\[:𝑛<sub>𝑒𝑑𝑖𝑡</sub><sub>\_</sub><sub>𝑠𝑖𝑚</sub>\]

If solution 𝑐 is correct (passes the instructor’s unit tests) then we assign its x position to 0. If it is not correct, we compute the x position as the average edit distance for items in NEAR\_EDIT:

![x\_position of c equals zero if c is correct. Otherwise it is the arithmetic mean, over p in NEAR\_EDIT of c, of minus edit\_distance of c and p.](https://from.so/assets/markdown/figures/zhang-vizprog-chi2023/formula-006-p009.png)

**Formula:** x\_position of c equals zero if c is correct. Otherwise it is the arithmetic mean, over p in NEAR\_EDIT of c, of minus edit\_distance of c and p.

Where ‘average’ represents the arithmetic mean. Note that we negate the edit distances, meaning x\_position(𝑐) is always ≤ 0 and larger numbers signify that 𝑐 is more similar to existing solutions.

#### 4.3.5 Computational Efficiency and Displaying Progress in Real- Time.

The process of building a solution space is computationally expensive but only needs to be done once before the instructor begins an exercise. After ⃗𝑦 has been computed, we can use it to quickly compute x\_position(𝑐) and y\_position(𝑐) for any student code 𝑐 at little computational cost. Computing the position of 𝑐<sub>𝑠,𝑡</sub> requires doing a forward pass of 𝑐<sub>𝑠,𝑡</sub> through the CodeBERT transformer, building NEAR\_APPROACH(𝑐<sub>𝑠,𝑡</sub>), taking the weighted sum to compute y\_position, computing NEAR\_EDIT(𝑐<sub>𝑠,𝑡</sub>), and taking the weighted sum to compute x\_position. Of these operations, the most computationally expensive is the forward pass through CodeBERT, which executes almost instantly on any modern GPU.

#### 4.3.6 Seeding VizProg with good sets of solutions.

Instructor-written solutions may only represent a subset of possible student solutions. Using solution sets that lack diversity in code could make the 2-D solution space less meaningful. Mapping instructor-written solutions directly to vertical positions on the map could exclude the diverse approaches that students take. It is likely the calculated vertical positions of some student solutions are outside the solution space. When visualizing these solutions on the 2-D map, the corresponding dots will be displayed at the edges of the map. Therefore, to build a solution space that would have meaningful results, users should collect a solution set that has diverse code in it, such as students’ solutions from previous semesters.

#### 4.3.7 Limitations.

<a id="page-10"></a>

There are several limitations of our approach. First, it requires an existing repository of attempted solutions to build a 2-D solution space. However, in future work, this solution space could instead be built as users complete their code without requiring any prior submissions. The primary challenge of doing this is that it would require re-building the 𝑃 matrix and re-performing the steps for dimensionality reduction as PAST\_CODE grows. This could be optimized by using incremental dimensionality reduction \[[12](<#page-15>)\] rather than re-doing the process from scratch. This way, most of the computational cost would determined by the amount of new data, rather than the total size of PAST\_CODE. We could also perform these steps asynchronously to ensure that there is no delay when rendering the visualization. We could also animate changes to the 2D solution space to make it easier for instructors to follow the visualization as it evolves. Second, VizProg relies on code to assess students’ progress but progress is not necessarily visible from the code alone. For example, students might write commented pseudo-code to describe the algorithm they plan to use for a problem before they start writing code. VizProg does not recognize or represent this kind of progress in its visualization. If a student is falling behind in VizProg, this is a sign that instructors should check in on the student—not definitive evidence that they are struggling. This means that VizProg can help instructors determine who to help but still requires instructors to use their judgement.

## 5 USER STUDY

We conducted a within-subject study to evaluate the effectiveness of VizProg for identifying students’ problems. In the study, we provided participants with a replay of pre-recorded authentic examples of students solving a programming problem, and asked them to answer quiz questions on students’ errors and progress. As our ‘baseline’ system, we used OverCode \[[14](<#page-15>)\], with two augmentations described in Section [5.1.4.](<#page-11>) We chose OverCode as a baseline because it is a state-of-the-art tool, it is open-source, and it shared a similar design goal with ours.

### 5.1 Method

#### 5.1.1 Recruitment.

Because the target users of VizProg are instructors, we primarily recruited participants with experience teaching programming courses. We reached out senior students from the \[redacted for anonymity\] and \[redacted for anonymity\] programs at \[redacted for anonymity\]. In the screening session, participants indicated their prior experience teaching Python. Qualified participants were experienced Python programmers, including teaching assistants, tutors, and senior students who have taken advanced Python programming courses before. We recruited 16 participants (10 self-identified as male, 6 as female) from a local participant pool. All 16 participants participated in the first session, and 15 participants participated in the second session. As Table [2](<#page-10>) shows, participants have experience in Python programming varies from 1 to more than 6 years. Among these participants, 14 had experience teaching programming courses.

#### 5.1.2 Live Simulation.

In order to ensure the data we used in the study were authentic, we used data collected from a large introductory programming course at \[redacted for anonymity\]. The course size ranges from 130–190 students. Our data were collected from an exercise within an interactive Python textbook used by the course. The data represented students’ attempts at solving exercises on their own time (rather than during time-limited class exercises)

Table 2: For the user study, we recruited 16 teaching assistants, tutors, instructors, and senior students who are experienced in Python programming.

<table>
  <thead>
    <tr>
      <th id="pdf-table-962:0-4846f9b1-table-10-10-0-0-dc56eef7" scope="col" data-pdf-scope="Both">PID</th>
      <th id="pdf-table-962:0-4846f9b1-table-10-10-0-1-1a578d83" scope="col" headers="pdf-table-962:0-4846f9b1-table-10-10-0-0-dc56eef7">Gender</th>
      <th id="pdf-table-962:0-4846f9b1-table-10-10-0-2-7dd3cc20" scope="col" headers="pdf-table-962:0-4846f9b1-table-10-10-0-0-dc56eef7">Teaching Exp.</th>
      <th id="pdf-table-962:0-4846f9b1-table-10-10-0-3-0aeb88dc" scope="col" headers="pdf-table-962:0-4846f9b1-table-10-10-0-0-dc56eef7">Python Prog. Exp.</th>
    </tr>
  </thead>
  <tbody>
    <tr>
      <th id="pdf-table-962:0-4846f9b1-table-10-10-1-0-a4097e65" scope="row" headers="pdf-table-962:0-4846f9b1-table-10-10-0-0-dc56eef7">P1</th>
      <td headers="pdf-table-962:0-4846f9b1-table-10-10-0-1-1a578d83 pdf-table-962:0-4846f9b1-table-10-10-1-0-a4097e65">Female</td>
      <td headers="pdf-table-962:0-4846f9b1-table-10-10-0-2-7dd3cc20 pdf-table-962:0-4846f9b1-table-10-10-1-0-a4097e65">Tutor</td>
      <td headers="pdf-table-962:0-4846f9b1-table-10-10-0-3-0aeb88dc pdf-table-962:0-4846f9b1-table-10-10-1-0-a4097e65">2 Years</td>
    </tr>
    <tr>
      <th id="pdf-table-962:0-4846f9b1-table-10-10-2-0-65abca6d" scope="row" headers="pdf-table-962:0-4846f9b1-table-10-10-0-0-dc56eef7">P2</th>
      <td headers="pdf-table-962:0-4846f9b1-table-10-10-0-1-1a578d83 pdf-table-962:0-4846f9b1-table-10-10-2-0-65abca6d">Male</td>
      <td headers="pdf-table-962:0-4846f9b1-table-10-10-0-2-7dd3cc20 pdf-table-962:0-4846f9b1-table-10-10-2-0-65abca6d">Teaching Assistant</td>
      <td headers="pdf-table-962:0-4846f9b1-table-10-10-0-3-0aeb88dc pdf-table-962:0-4846f9b1-table-10-10-2-0-65abca6d">3 Years</td>
    </tr>
    <tr>
      <th id="pdf-table-962:0-4846f9b1-table-10-10-3-0-7d2cbe2f" scope="row" headers="pdf-table-962:0-4846f9b1-table-10-10-0-0-dc56eef7">P3</th>
      <td headers="pdf-table-962:0-4846f9b1-table-10-10-0-1-1a578d83 pdf-table-962:0-4846f9b1-table-10-10-3-0-7d2cbe2f">Male</td>
      <td headers="pdf-table-962:0-4846f9b1-table-10-10-0-2-7dd3cc20 pdf-table-962:0-4846f9b1-table-10-10-3-0-7d2cbe2f">Teaching Assistant</td>
      <td headers="pdf-table-962:0-4846f9b1-table-10-10-0-3-0aeb88dc pdf-table-962:0-4846f9b1-table-10-10-3-0-7d2cbe2f">1 Year</td>
    </tr>
    <tr>
      <th id="pdf-table-962:0-4846f9b1-table-10-10-4-0-d3a0d811" scope="row" headers="pdf-table-962:0-4846f9b1-table-10-10-0-0-dc56eef7">P4</th>
      <td headers="pdf-table-962:0-4846f9b1-table-10-10-0-1-1a578d83 pdf-table-962:0-4846f9b1-table-10-10-4-0-d3a0d811">Male</td>
      <td headers="pdf-table-962:0-4846f9b1-table-10-10-0-2-7dd3cc20 pdf-table-962:0-4846f9b1-table-10-10-4-0-d3a0d811">Teaching Assistant</td>
      <td headers="pdf-table-962:0-4846f9b1-table-10-10-0-3-0aeb88dc pdf-table-962:0-4846f9b1-table-10-10-4-0-d3a0d811">6+ Years</td>
    </tr>
    <tr>
      <th id="pdf-table-962:0-4846f9b1-table-10-10-5-0-1dbe8615" scope="row" headers="pdf-table-962:0-4846f9b1-table-10-10-0-0-dc56eef7">P5</th>
      <td headers="pdf-table-962:0-4846f9b1-table-10-10-0-1-1a578d83 pdf-table-962:0-4846f9b1-table-10-10-5-0-1dbe8615">Female</td>
      <td headers="pdf-table-962:0-4846f9b1-table-10-10-0-2-7dd3cc20 pdf-table-962:0-4846f9b1-table-10-10-5-0-1dbe8615">Teaching Assistant</td>
      <td headers="pdf-table-962:0-4846f9b1-table-10-10-0-3-0aeb88dc pdf-table-962:0-4846f9b1-table-10-10-5-0-1dbe8615">3 Years</td>
    </tr>
    <tr>
      <th id="pdf-table-962:0-4846f9b1-table-10-10-6-0-609dd5b7" scope="row" headers="pdf-table-962:0-4846f9b1-table-10-10-0-0-dc56eef7">P6</th>
      <td headers="pdf-table-962:0-4846f9b1-table-10-10-0-1-1a578d83 pdf-table-962:0-4846f9b1-table-10-10-6-0-609dd5b7">Female</td>
      <td headers="pdf-table-962:0-4846f9b1-table-10-10-0-2-7dd3cc20 pdf-table-962:0-4846f9b1-table-10-10-6-0-609dd5b7">Teaching Assistant</td>
      <td headers="pdf-table-962:0-4846f9b1-table-10-10-0-3-0aeb88dc pdf-table-962:0-4846f9b1-table-10-10-6-0-609dd5b7">3 Years</td>
    </tr>
    <tr>
      <th id="pdf-table-962:0-4846f9b1-table-10-10-7-0-cc0cb00e" scope="row" headers="pdf-table-962:0-4846f9b1-table-10-10-0-0-dc56eef7">P7</th>
      <td headers="pdf-table-962:0-4846f9b1-table-10-10-0-1-1a578d83 pdf-table-962:0-4846f9b1-table-10-10-7-0-cc0cb00e">Male</td>
      <td headers="pdf-table-962:0-4846f9b1-table-10-10-0-2-7dd3cc20 pdf-table-962:0-4846f9b1-table-10-10-7-0-cc0cb00e">Teaching Assistant</td>
      <td headers="pdf-table-962:0-4846f9b1-table-10-10-0-3-0aeb88dc pdf-table-962:0-4846f9b1-table-10-10-7-0-cc0cb00e">2 Years</td>
    </tr>
    <tr>
      <th id="pdf-table-962:0-4846f9b1-table-10-10-8-0-c74519ce" scope="row" headers="pdf-table-962:0-4846f9b1-table-10-10-0-0-dc56eef7">P8</th>
      <td headers="pdf-table-962:0-4846f9b1-table-10-10-0-1-1a578d83 pdf-table-962:0-4846f9b1-table-10-10-8-0-c74519ce">Male</td>
      <td headers="pdf-table-962:0-4846f9b1-table-10-10-0-2-7dd3cc20 pdf-table-962:0-4846f9b1-table-10-10-8-0-c74519ce">Teaching Assistant</td>
      <td headers="pdf-table-962:0-4846f9b1-table-10-10-0-3-0aeb88dc pdf-table-962:0-4846f9b1-table-10-10-8-0-c74519ce">1 Year</td>
    </tr>
    <tr>
      <th id="pdf-table-962:0-4846f9b1-table-10-10-9-0-ef5bf439" scope="row" headers="pdf-table-962:0-4846f9b1-table-10-10-0-0-dc56eef7">P9</th>
      <td headers="pdf-table-962:0-4846f9b1-table-10-10-0-1-1a578d83 pdf-table-962:0-4846f9b1-table-10-10-9-0-ef5bf439">Male</td>
      <td headers="pdf-table-962:0-4846f9b1-table-10-10-0-2-7dd3cc20 pdf-table-962:0-4846f9b1-table-10-10-9-0-ef5bf439">Teaching Assistant</td>
      <td headers="pdf-table-962:0-4846f9b1-table-10-10-0-3-0aeb88dc pdf-table-962:0-4846f9b1-table-10-10-9-0-ef5bf439">5 Years</td>
    </tr>
    <tr>
      <th id="pdf-table-962:0-4846f9b1-table-10-10-10-0-197a3d25" scope="row" headers="pdf-table-962:0-4846f9b1-table-10-10-0-0-dc56eef7">P10</th>
      <td headers="pdf-table-962:0-4846f9b1-table-10-10-0-1-1a578d83 pdf-table-962:0-4846f9b1-table-10-10-10-0-197a3d25">Female</td>
      <td headers="pdf-table-962:0-4846f9b1-table-10-10-0-2-7dd3cc20 pdf-table-962:0-4846f9b1-table-10-10-10-0-197a3d25">Teaching Assistant</td>
      <td headers="pdf-table-962:0-4846f9b1-table-10-10-0-3-0aeb88dc pdf-table-962:0-4846f9b1-table-10-10-10-0-197a3d25">4 Years</td>
    </tr>
    <tr>
      <th id="pdf-table-962:0-4846f9b1-table-10-10-11-0-b9d7d851" scope="row" headers="pdf-table-962:0-4846f9b1-table-10-10-0-0-dc56eef7">P11</th>
      <td headers="pdf-table-962:0-4846f9b1-table-10-10-0-1-1a578d83 pdf-table-962:0-4846f9b1-table-10-10-11-0-b9d7d851">Male</td>
      <td headers="pdf-table-962:0-4846f9b1-table-10-10-0-2-7dd3cc20 pdf-table-962:0-4846f9b1-table-10-10-11-0-b9d7d851">Instructor</td>
      <td headers="pdf-table-962:0-4846f9b1-table-10-10-0-3-0aeb88dc pdf-table-962:0-4846f9b1-table-10-10-11-0-b9d7d851">1 Year</td>
    </tr>
    <tr>
      <th id="pdf-table-962:0-4846f9b1-table-10-10-12-0-a6150f29" scope="row" headers="pdf-table-962:0-4846f9b1-table-10-10-0-0-dc56eef7">P12</th>
      <td headers="pdf-table-962:0-4846f9b1-table-10-10-0-1-1a578d83 pdf-table-962:0-4846f9b1-table-10-10-12-0-a6150f29">Male</td>
      <td headers="pdf-table-962:0-4846f9b1-table-10-10-0-2-7dd3cc20 pdf-table-962:0-4846f9b1-table-10-10-12-0-a6150f29">Teaching Assistant</td>
      <td headers="pdf-table-962:0-4846f9b1-table-10-10-0-3-0aeb88dc pdf-table-962:0-4846f9b1-table-10-10-12-0-a6150f29">2 Years</td>
    </tr>
    <tr>
      <th id="pdf-table-962:0-4846f9b1-table-10-10-13-0-9c20cefa" scope="row" headers="pdf-table-962:0-4846f9b1-table-10-10-0-0-dc56eef7">P13</th>
      <td headers="pdf-table-962:0-4846f9b1-table-10-10-0-1-1a578d83 pdf-table-962:0-4846f9b1-table-10-10-13-0-9c20cefa">Female</td>
      <td headers="pdf-table-962:0-4846f9b1-table-10-10-0-2-7dd3cc20 pdf-table-962:0-4846f9b1-table-10-10-13-0-9c20cefa">Teaching Assistant</td>
      <td headers="pdf-table-962:0-4846f9b1-table-10-10-0-3-0aeb88dc pdf-table-962:0-4846f9b1-table-10-10-13-0-9c20cefa">6 Years</td>
    </tr>
    <tr>
      <th id="pdf-table-962:0-4846f9b1-table-10-10-14-0-ae6e15d5" scope="row" headers="pdf-table-962:0-4846f9b1-table-10-10-0-0-dc56eef7">P14</th>
      <td headers="pdf-table-962:0-4846f9b1-table-10-10-0-1-1a578d83 pdf-table-962:0-4846f9b1-table-10-10-14-0-ae6e15d5">Male</td>
      <td headers="pdf-table-962:0-4846f9b1-table-10-10-0-2-7dd3cc20 pdf-table-962:0-4846f9b1-table-10-10-14-0-ae6e15d5">None</td>
      <td headers="pdf-table-962:0-4846f9b1-table-10-10-0-3-0aeb88dc pdf-table-962:0-4846f9b1-table-10-10-14-0-ae6e15d5">4 Years</td>
    </tr>
    <tr>
      <th id="pdf-table-962:0-4846f9b1-table-10-10-15-0-20b57f77" scope="row" headers="pdf-table-962:0-4846f9b1-table-10-10-0-0-dc56eef7">P15</th>
      <td headers="pdf-table-962:0-4846f9b1-table-10-10-0-1-1a578d83 pdf-table-962:0-4846f9b1-table-10-10-15-0-20b57f77">Female</td>
      <td headers="pdf-table-962:0-4846f9b1-table-10-10-0-2-7dd3cc20 pdf-table-962:0-4846f9b1-table-10-10-15-0-20b57f77">Teaching Assistant</td>
      <td headers="pdf-table-962:0-4846f9b1-table-10-10-0-3-0aeb88dc pdf-table-962:0-4846f9b1-table-10-10-15-0-20b57f77">3 Years</td>
    </tr>
    <tr>
      <th id="pdf-table-962:0-4846f9b1-table-10-10-16-0-60e1a97d" scope="row" headers="pdf-table-962:0-4846f9b1-table-10-10-0-0-dc56eef7">P16</th>
      <td headers="pdf-table-962:0-4846f9b1-table-10-10-0-1-1a578d83 pdf-table-962:0-4846f9b1-table-10-10-16-0-60e1a97d">Male</td>
      <td headers="pdf-table-962:0-4846f9b1-table-10-10-0-2-7dd3cc20 pdf-table-962:0-4846f9b1-table-10-10-16-0-60e1a97d">None</td>
      <td headers="pdf-table-962:0-4846f9b1-table-10-10-0-3-0aeb88dc pdf-table-962:0-4846f9b1-table-10-10-16-0-60e1a97d">2 Years</td>
    </tr>
  </tbody>
</table>

but they contained genuine examples of misunderstandings and challenges that students faced when attempting the exercises. We first collected students’ submissions for 100 programming exercises from the course. We filtered the dataset by the number of students who submitted solutions to the exercise, and the number of submissions made per students. We ended up getting 69 programming exercises which have more than 100 students’ submissions and each student have more than 2 submissions in average. We chose two programming exercises from the filtered dataset, one for each session, that were roughly equivalent in terms of complexity:

Exercise 1 (E1): Provided is a string saved to the variable s1. Create a dictionary named counts that contains each letter in s1 and the number of times it occurs.

Exercise 2 (E2): Create a list of numbers 0 through 40 and assign this list to the variable numbers. Then, accumulate the total of the list’s values and assign that sum to the variable sum1.

E1 had 627 Python code snippets from 109 students. E2 had 823 Python code snippets from 117 students. The solutions varied from 2 lines to 20 lines of code. The submission time ranges from a few minutes to several days. We trim the submission by setting a time threshold and them normalized the time to a 15 minute time window. We also checked each submission to ensure that it did not contain any identifying information or present any privacy concerns and anonymized appropriately[2](<#page-10>).

<a id="page-11"></a>

The data captured contained a snapshot of every submission that students made (every time they ran the code). However, we want our evaluation to work with keystroke-level data. To maintain the setting realism and ensure participants’ experience quality, we generated synthetic keystroke-level data from the submissions to simulate students’ typing activities. For each submission, we compared it with the most recent previous submission, calculated the string difference between them. For each addition and deletion in the difference, we split it into character level editing activities. With the keystroke-level data, participants observed students consistently changing from one submission to the next submission character by character, rather than sudden jumps in the solution space.

> <sup>2</sup>In our examples, there was no identifying information contained in code. In other examples, students might use their given name as a variable name or output their name in their code.

Finally, we computed our visualization in a way that the visualization of 𝑐<sub>𝑠,𝑡</sub> could never depend on student 𝑠’s code after time 𝑡 (no forward dependencies). This means that the trajectory for each student is what would be generated if that student’s solutions were embedded in a space generated from the rest of the solutions, a setup conceptually similar to cross-validation.

#### 5.1.3 Study Setup.

Our evaluation was within-subjects, where participants joined two sessions—one with the baseline system and one with VizProg. We counterbalanced the order of the systems and tasks. We provided 15 minutes of training on how to use each system. To ensure participants get enough practice of using the system, we provided an example using scenario for users to explore the user interface. In the practice example, participants watched a replay of 20 students solving a programming problem and we asked them to perform some exercises using the system.

After training, participants began the study. Participants watched a replay of students solving a programming exercise for 15 minutes (109 students for E1 and 117 students for E2). During the replay, participants were asked to use the system to answer quiz questions around students’ errors and progress. After the replay, participants had 20 minutes to finish the quiz questions based on the final results of the replay. After each session, participants were asked to complete a survey regarding their experience of using the system. After the second session (with the same procedure but a different system), we conducted a reflective interview for comparing the systems.

We conducted this study remotely using Zoom, and each session lasted about 60 minutes. We recorded the screencast of them performing the task, their answers to the survey, and the audio of their think aloud process and their answers to our follow up interview. We compensated each participant with a $25 USD Amazon Gift Card for each session.

#### 5.1.4 Baseline.

We chose OverCode \[[14](<#page-15>)\] as the baseline, which clusters correct code submissions by computational results. Over- Code is an effective tool for understanding submissions at scale. However, OverCode \[[14](<#page-15>)\] is not designed for live settings. To make the comparison fairer (not biased in favor of VizProg), We developed a Jupyter Lab extension that updated OverCode results in real-time. Both the baseline system and VizProg are implemented as Jupyter Lab extensions. During the study, participants used Jupyter Lab to watch the replay. For participants who used OverCode \[[14](<#page-15>)\], we also provided the original OverCode user interface after the replay finished.

#### 5.1.5 Data Collection.

In the screening session, we collected data on participants’ teaching experience and Python programming experience. For each session, one member of the research team was present. We created a list of code scheme of behaviors observed from the study. For students’ answers to the quiz questions, one member of the research team graded the correctness of the answers. At the end of each session, we asked participants to fill out a survey and compared the two session’s results. After the second session, we conducted interviews with participants, where we asked participants to compare the baseline system and VizProg. We worded our questions in a way that tried to elicit more honest feedback by not revealing which system was the ‘control’.

### 5.2 Results

The quiz was designed as multiple-choice questions and open-ended questions. We graded participants’ answers to each multiple-choice question. One member of the research team created a list of correct answers to the quiz questions based on the replay. To grade participants’ answers, we calculated

![Quiz accuracy equals the number of matched answers divided by the maximum of the total number of correct answers and the total number of selected answers.](https://from.so/assets/markdown/figures/zhang-vizprog-chi2023/formula-007-p011.png)

**Formula:** Quiz accuracy equals the number of matched answers divided by the maximum of the total number of correct answers and the total number of selected answers.

to work out their grades for the quiz. We also coded the screen recordings to analyse the time spent on each quiz question. We used a two-tailed Welch’s t-test to determine significance for our statistical analysis. For the open-ended questions in the quiz, we analysed the screen recordings to understand how participants interact with the tool to perform the tasks.

#### 5.2.1 Participants understand students’ problems more accurately using VizProg than the baseline.

In the first session, we designed the quiz questions as multiple-choice questions, which were more direct and required users to find the information about specific students. In the second session, we designed the quiz questions to be more open-ended, which encouraged participants to explore the system and interact with the whole dataset. For the multiple-choice questions, We found that participants’ accuracy with VizProg (𝜇 = 79.6%, 𝜎 = 0.1) is significantly higher than participants’ grade with the baseline system (𝜇 = 51.4%, 𝜎 = 0.2, 𝑝 &lt; 0.0001).

In the open-ended questions, we asked participants to use the system to find common misunderstandings of the whole class. We coded the misunderstandings participants found during the study. Comparing to the list of existing misunderstandings generated by the researcher, we calculated the number of valid misunderstandings participants mentioned. As shown in Table [3,](<#page-12>) the valid misunderstandings participants found using VizProg (𝜇 = 4.5, 𝜎 = 1.5) is significantly more than what they found using the baseline system (𝜇 = 2.4, 𝜎 = 0.5, 𝑝 &lt; 0.01). We listed the misunderstandings participants found in two conditions in Table [3.](<#page-12>) In the control condition, 4 out of 7 participants described misunderstandings in a general way, using terms including “Name Error”, “Type Error” and “Syntax Error”. In VizProg, 6 out of 8 participants described misunderstandings more specifically by pointing out the parts that made the solution incorrect.

#### 5.2.2 VizProg settings than the baseline.

helps participants understand issues faster in live To investigate how the two systems help participants understand students’ problems in live settings, we calculated 1) when participants started finding errors, and 2) how much time they spent to find students’ errors. We found participants using the baseline system started identifying errors significantly later than participants using VizProg (𝑝 &lt; 0.05). In the baseline system, participants started finding errors 1069.9 seconds after

<a id="page-12"></a>

Table 3: Common misunderstandings participants found in the second session. The third column lists all the misunderstandings per participant, and the fourth column calculates the total number of the misunderstandings the participant identified in the study.

<table>
  <thead>
    <tr>
      <th id="pdf-table-1089:0-10983681-table-12-2-0-0-d8e8a3b8" scope="col" data-pdf-scope="Both">PID</th>
      <th id="pdf-table-1089:0-10983681-table-12-2-0-1-48ea48ae" scope="col" headers="pdf-table-1089:0-10983681-table-12-2-0-0-d8e8a3b8">Condition</th>
      <th id="pdf-table-1089:0-10983681-table-12-2-0-2-fbf1addc" scope="col" headers="pdf-table-1089:0-10983681-table-12-2-0-0-d8e8a3b8">Misunderstandings</th>
      <th id="pdf-table-1089:0-10983681-table-12-2-0-3-fff6b022" scope="col" headers="pdf-table-1089:0-10983681-table-12-2-0-0-d8e8a3b8">Count</th>
    </tr>
  </thead>
  <tbody>
    <tr>
      <th id="pdf-table-1089:0-10983681-table-12-2-1-0-7f22c84b" scope="row" headers="pdf-table-1089:0-10983681-table-12-2-0-0-d8e8a3b8">P3</th>
      <td headers="pdf-table-1089:0-10983681-table-12-2-0-1-48ea48ae pdf-table-1089:0-10983681-table-12-2-1-0-7f22c84b">Baseline</td>
      <td headers="pdf-table-1089:0-10983681-table-12-2-0-2-fbf1addc pdf-table-1089:0-10983681-table-12-2-1-0-7f22c84b">Use wrong variable in summation, Range excludes parameter “end”</td>
      <td headers="pdf-table-1089:0-10983681-table-12-2-0-3-fff6b022 pdf-table-1089:0-10983681-table-12-2-1-0-7f22c84b">2</td>
    </tr>
    <tr>
      <th id="pdf-table-1089:0-10983681-table-12-2-2-0-95eb0940" scope="row" headers="pdf-table-1089:0-10983681-table-12-2-0-0-d8e8a3b8">P4</th>
      <td headers="pdf-table-1089:0-10983681-table-12-2-0-1-48ea48ae pdf-table-1089:0-10983681-table-12-2-2-0-95eb0940">Baseline</td>
      <td headers="pdf-table-1089:0-10983681-table-12-2-0-2-fbf1addc pdf-table-1089:0-10983681-table-12-2-2-0-95eb0940">Name Error, Syntax Error, Use wrong variable in summation</td>
      <td headers="pdf-table-1089:0-10983681-table-12-2-0-3-fff6b022 pdf-table-1089:0-10983681-table-12-2-2-0-95eb0940">3</td>
    </tr>
    <tr>
      <th id="pdf-table-1089:0-10983681-table-12-2-3-0-788caf22" scope="row" headers="pdf-table-1089:0-10983681-table-12-2-0-0-d8e8a3b8">P5</th>
      <td headers="pdf-table-1089:0-10983681-table-12-2-0-1-48ea48ae pdf-table-1089:0-10983681-table-12-2-3-0-788caf22">Baseline</td>
      <td headers="pdf-table-1089:0-10983681-table-12-2-0-2-fbf1addc pdf-table-1089:0-10983681-table-12-2-3-0-788caf22">Use variable not defined, Do not know how to create a new list</td>
      <td headers="pdf-table-1089:0-10983681-table-12-2-0-3-fff6b022 pdf-table-1089:0-10983681-table-12-2-3-0-788caf22">2</td>
    </tr>
    <tr>
      <th id="pdf-table-1089:0-10983681-table-12-2-4-0-a4b176a8" scope="row" headers="pdf-table-1089:0-10983681-table-12-2-0-0-d8e8a3b8">P6</th>
      <td headers="pdf-table-1089:0-10983681-table-12-2-0-1-48ea48ae pdf-table-1089:0-10983681-table-12-2-4-0-a4b176a8">Baseline</td>
      <td headers="pdf-table-1089:0-10983681-table-12-2-0-2-fbf1addc pdf-table-1089:0-10983681-table-12-2-4-0-a4b176a8">Type Error, Name Error, Use wrong variable in summation</td>
      <td headers="pdf-table-1089:0-10983681-table-12-2-0-3-fff6b022 pdf-table-1089:0-10983681-table-12-2-4-0-a4b176a8">3</td>
    </tr>
    <tr>
      <th id="pdf-table-1089:0-10983681-table-12-2-5-0-0934cda5" scope="row" headers="pdf-table-1089:0-10983681-table-12-2-0-0-d8e8a3b8">P11</th>
      <td headers="pdf-table-1089:0-10983681-table-12-2-0-1-48ea48ae pdf-table-1089:0-10983681-table-12-2-5-0-0934cda5">Baseline</td>
      <td headers="pdf-table-1089:0-10983681-table-12-2-0-2-fbf1addc pdf-table-1089:0-10983681-table-12-2-5-0-0934cda5">Type Error, Name Error</td>
      <td headers="pdf-table-1089:0-10983681-table-12-2-0-3-fff6b022 pdf-table-1089:0-10983681-table-12-2-5-0-0934cda5">2</td>
    </tr>
    <tr>
      <th id="pdf-table-1089:0-10983681-table-12-2-6-0-ab217164" scope="row" headers="pdf-table-1089:0-10983681-table-12-2-0-0-d8e8a3b8">P14</th>
      <td headers="pdf-table-1089:0-10983681-table-12-2-0-1-48ea48ae pdf-table-1089:0-10983681-table-12-2-6-0-ab217164">Baseline</td>
      <td headers="pdf-table-1089:0-10983681-table-12-2-0-2-fbf1addc pdf-table-1089:0-10983681-table-12-2-6-0-ab217164">Name Error, Do not know how to create a new list, Range excludes parameter “end”</td>
      <td headers="pdf-table-1089:0-10983681-table-12-2-0-3-fff6b022 pdf-table-1089:0-10983681-table-12-2-6-0-ab217164">3</td>
    </tr>
    <tr>
      <th id="pdf-table-1089:0-10983681-table-12-2-7-0-c7ca9199" scope="row" headers="pdf-table-1089:0-10983681-table-12-2-0-0-d8e8a3b8">P15</th>
      <td headers="pdf-table-1089:0-10983681-table-12-2-0-1-48ea48ae pdf-table-1089:0-10983681-table-12-2-7-0-c7ca9199">Baseline</td>
      <td headers="pdf-table-1089:0-10983681-table-12-2-0-2-fbf1addc pdf-table-1089:0-10983681-table-12-2-7-0-c7ca9199">Use variable not defined, Use wrong variable in summation</td>
      <td headers="pdf-table-1089:0-10983681-table-12-2-0-3-fff6b022 pdf-table-1089:0-10983681-table-12-2-7-0-c7ca9199">2</td>
    </tr>
    <tr>
      <th id="pdf-table-1089:0-10983681-table-12-2-8-0-a03acecf" scope="row" headers="pdf-table-1089:0-10983681-table-12-2-0-0-d8e8a3b8">P1</th>
      <td headers="pdf-table-1089:0-10983681-table-12-2-0-1-48ea48ae pdf-table-1089:0-10983681-table-12-2-8-0-a03acecf">VizProg</td>
      <td headers="pdf-table-1089:0-10983681-table-12-2-0-2-fbf1addc pdf-table-1089:0-10983681-table-12-2-8-0-a03acecf">Type Error, Syntax Error, Use variable not defined, Iterate on int object, Use wrong variable in summation</td>
      <td headers="pdf-table-1089:0-10983681-table-12-2-0-3-fff6b022 pdf-table-1089:0-10983681-table-12-2-8-0-a03acecf">5</td>
    </tr>
    <tr>
      <th id="pdf-table-1089:0-10983681-table-12-2-9-0-eb97fe5a" scope="row" headers="pdf-table-1089:0-10983681-table-12-2-0-0-d8e8a3b8">P2</th>
      <td headers="pdf-table-1089:0-10983681-table-12-2-0-1-48ea48ae pdf-table-1089:0-10983681-table-12-2-9-0-eb97fe5a">VizProg</td>
      <td headers="pdf-table-1089:0-10983681-table-12-2-0-2-fbf1addc pdf-table-1089:0-10983681-table-12-2-9-0-eb97fe5a">VizProg Iterate on int object, Use wrong variable in summation, General usage of range, Return value of range</td>
      <td headers="pdf-table-1089:0-10983681-table-12-2-0-3-fff6b022 pdf-table-1089:0-10983681-table-12-2-9-0-eb97fe5a">4</td>
    </tr>
    <tr>
      <th id="pdf-table-1089:0-10983681-table-12-2-10-0-4d89dda4" scope="row" headers="pdf-table-1089:0-10983681-table-12-2-0-0-d8e8a3b8">P7</th>
      <td headers="pdf-table-1089:0-10983681-table-12-2-0-1-48ea48ae pdf-table-1089:0-10983681-table-12-2-10-0-4d89dda4">VizProg</td>
      <td headers="pdf-table-1089:0-10983681-table-12-2-0-2-fbf1addc pdf-table-1089:0-10983681-table-12-2-10-0-4d89dda4">Use wrong variable in summation, Use append method in an incorrect way, Initialize range</td>
      <td headers="pdf-table-1089:0-10983681-table-12-2-0-3-fff6b022 pdf-table-1089:0-10983681-table-12-2-10-0-4d89dda4">3</td>
    </tr>
    <tr>
      <th id="pdf-table-1089:0-10983681-table-12-2-11-0-801bdda6" scope="row" headers="pdf-table-1089:0-10983681-table-12-2-0-0-d8e8a3b8">P9</th>
      <td headers="pdf-table-1089:0-10983681-table-12-2-0-1-48ea48ae pdf-table-1089:0-10983681-table-12-2-11-0-801bdda6">VizProg</td>
      <td headers="pdf-table-1089:0-10983681-table-12-2-0-2-fbf1addc pdf-table-1089:0-10983681-table-12-2-11-0-801bdda6">Type Error, Name Error, Key Error</td>
      <td headers="pdf-table-1089:0-10983681-table-12-2-0-3-fff6b022 pdf-table-1089:0-10983681-table-12-2-11-0-801bdda6">3</td>
    </tr>
    <tr>
      <th id="pdf-table-1089:0-10983681-table-12-2-12-0-29bdafa6" scope="row" headers="pdf-table-1089:0-10983681-table-12-2-0-0-d8e8a3b8">P10</th>
      <td headers="pdf-table-1089:0-10983681-table-12-2-0-1-48ea48ae pdf-table-1089:0-10983681-table-12-2-12-0-29bdafa6">VizProg</td>
      <td headers="pdf-table-1089:0-10983681-table-12-2-0-2-fbf1addc pdf-table-1089:0-10983681-table-12-2-12-0-29bdafa6">Use variable not defined, For loop on item not iterable, Use append method in an incorrect way, Add up array and int, Use methods that do not exist, General usage of range</td>
      <td headers="pdf-table-1089:0-10983681-table-12-2-0-3-fff6b022 pdf-table-1089:0-10983681-table-12-2-12-0-29bdafa6">6</td>
    </tr>
    <tr>
      <th id="pdf-table-1089:0-10983681-table-12-2-13-0-f98c3ab4" scope="row" headers="pdf-table-1089:0-10983681-table-12-2-0-0-d8e8a3b8">P12</th>
      <td headers="pdf-table-1089:0-10983681-table-12-2-0-1-48ea48ae pdf-table-1089:0-10983681-table-12-2-13-0-f98c3ab4">VizProg</td>
      <td headers="pdf-table-1089:0-10983681-table-12-2-0-2-fbf1addc pdf-table-1089:0-10983681-table-12-2-13-0-f98c3ab4">Use variable not defined, Use wrong variable in summation, Hard code, Incomplete expression, Did not add numbers in loop</td>
      <td headers="pdf-table-1089:0-10983681-table-12-2-0-3-fff6b022 pdf-table-1089:0-10983681-table-12-2-13-0-f98c3ab4">5</td>
    </tr>
    <tr>
      <th id="pdf-table-1089:0-10983681-table-12-2-14-0-abb231a0" scope="row" headers="pdf-table-1089:0-10983681-table-12-2-0-0-d8e8a3b8">P13</th>
      <td headers="pdf-table-1089:0-10983681-table-12-2-0-1-48ea48ae pdf-table-1089:0-10983681-table-12-2-14-0-abb231a0">VizProg</td>
      <td headers="pdf-table-1089:0-10983681-table-12-2-0-2-fbf1addc pdf-table-1089:0-10983681-table-12-2-14-0-abb231a0">Use variable not defined, Iterate on int object, Use wrong variable in summation, Use append method in an incorrect way, Add up array and int, Index on variable that does not support indexing, Miss right bracket on print</td>
      <td headers="pdf-table-1089:0-10983681-table-12-2-0-3-fff6b022 pdf-table-1089:0-10983681-table-12-2-14-0-abb231a0">7</td>
    </tr>
    <tr>
      <th id="pdf-table-1089:0-10983681-table-12-2-15-0-f4c29736" scope="row" headers="pdf-table-1089:0-10983681-table-12-2-0-0-d8e8a3b8">P16</th>
      <td headers="pdf-table-1089:0-10983681-table-12-2-0-1-48ea48ae pdf-table-1089:0-10983681-table-12-2-15-0-f4c29736">VizProg</td>
      <td headers="pdf-table-1089:0-10983681-table-12-2-0-2-fbf1addc pdf-table-1089:0-10983681-table-12-2-15-0-f4c29736">Use variable not defined, Do not know how to create a new list, Range excludes parameter ’end’</td>
      <td headers="pdf-table-1089:0-10983681-table-12-2-0-3-fff6b022 pdf-table-1089:0-10983681-table-12-2-15-0-f4c29736">3</td>
    </tr>
  </tbody>
</table>

the replay starts in average (𝜎 = 360.2). In VizProg, participants started finding errors 500.1 seconds after the replay starts in average (𝜎 = 468.2). As the replay lasted 15 minutes, this indicated that with VizProg, people are able to understand students’ problems synchronously with students working on the problem, while in the baseline system, people tended to wait until students finished the exercise. We did not find significant difference of how much time they spent on finding errors between two conditions (VizProg 𝜇 = 261.5 seconds, baseline 𝜇 = 214.9 seconds, 𝑝 &gt; 0.05)

### 5.3 System Usability and Study Insights

To better understand VizProg’s usability benefits or issues, we ran a thematic analysis on the interview transcripts with our own observations of participants’ behavior patterns from the video.

#### 5.3.1 VizProg helps participants understand in live settings with less context switching.

As we showed in Section [5.2,](<#page-11>) participants can understand students’ problems faster and more accurately using VizProg than the baseline system. Based on our observation, we found that using VizProg takes participants less context switch to understand errors in live settings. In VizProg, instructors can quickly understand errors of the whole classroom by watching the 2-D map instead of checking every students’ editing history. In both sessions, we pointed participants to the most popular solution, and asked participants to find out errors for that solution. In the control condition, 8 participants needed to look at individual students’ submissions to understand what were the misunderstandings they had. 3 participants (P1, P6, P10) went through every student in that group and spent more than 8 minutes looking at their submissions. Given the large number of students in the class, 12 out of 15 participants randomly selected a few students from the group and checked their history versions.

While in the treatment condition (with VizProg), 15 out of 16 participants used the 2D Euclidean map to interact with the whole class’s submission. They brushed and selected an area on the map and checked in on different error types on the right side of the tool. Participants found VizProg helpful because similar submissions are grouped in a small area (P2, P9, P10, P14, P16) and incorrect submissions are grouped by error types(P1-3, P5, P7, P9-12, P14-16). VizProg also enables participants to understand students’ problems synchronously as students are working on the problem, while in the control condition, participants need to wait until they finish(P3-6, P14-15).

#### 5.3.2 Visualizing progress on a 2D map takes participants less effort to validate students’ progress.

<a id="page-13"></a>

In the second session, we asked participants to find students who did not finish the programming problem. Among these students, participants were asked to decide who were close to a correct solution and who needed more help. In the control condition, participants looked at the history versions of all students that did not have a correct solution, and then decided whether they need further help. In the treatment condition, participants checked the trajectory on the map for each student that had an incorrect submission at the end. Participants found that some students “were very close to the correct solutions on the map, I think they only need to replace the variable name (P9-10, P15),” while some other students “they were very far away from the map, I think they don’t understand the concepts and would talk to them (P9).” Participants also noticed that “they actually already reach the correct solution but they went back changing to a different approach, and never get it correct later, I don’t understand what’s going on. (P12)”

“... The whole movement from left to right is basically telling me the progress the student is making towards the right answer, whereas in OverCode it was more like just set of blocks, and there was no indication whether the final one is the right or not. Um! It was just showing me the dotted saying that this is the current portion of it. But as this was more easier, even just from the graph aspect as well... (P1)”

#### 5.3.3 VizProg enables users to quickly form a strategy to decide who to give feedback to.

In the second session, we asked participants to first find students that need help, and then give feedback to these students. We observed different behavior between two conditions for giving feedback to the students.

In the control condition, participants looked at all the final submissions and found there were 18 students who did not have a correct solution when the simulation stopped. They decided that all the 18 students need help. 2 out 7 participants went over every student’s final submission and generated feedback based on the errors in each submission. 5 participants randomly looked at some of the students’ final submission and gave feedback to them, skipped the other students.

In the treatment condition, participants first searched for dots that were out of place in the 2D map. Participants then brushed and selected areas on the map, and found that dots that are close to each other had similar misconceptions, so they decided to give the same feedback to them. Participants also found that dots on the far left side of the map had submissions that were very far away from a correct solution, while dots on the right side of the map had submissions only needed a few edits to become a correct solution. 5 out of 8 participants decided to give more detailed feedback for the dots on the far left side and talk to the students, and guide the dots on the right side to a correct solution that is close on the map.

This indicated that in the control condition, participants lacked a strategy in giving feedback and made decisions based on randomly looking at students’ code. In the treatment condition, participants quickly formed a strategy of using the map to generate feedback at different granularity. Using VizProg, participants can use the visual guidance on the map to give feedback at various levels (i.e., the individual level, the group level) shortly.

#### 5.3.4 Visualizing progress at scale can still be overwhelming.

Despite of the benefits mentioned above, 4 participants (P4, P6, P12- 13) found the 2D map in VizProg overwhelming when all the dots started to move.

“...I had to select a particular set of students. I had to drag and drop on the graph, and I wasn’t entirely sure how that was going, plus the the whole thing about the student moving from one solution to another... (P4)”

Even in the control condition where we use conventional code editors instead of a 2D map, participants still found it overwhelming when many students started working on their code (P2, P9-10, P12, P15).

Although we followed the rationale that students moving from left to the right means that they are moving from incorrect solution to a correct solution, the map does not have explicit semantic meaning for the position. P1 mentioned that “I have to brush and select an area to look at the code.” P1 and P10 wished they “can see more information from the map without extra interaction”. However, encoding more information on the map could lead to more cognitive load for users to validate progress at scale. P6 and P13 said they prefer the baseline system because they can directly see what’s going on in each student’s editor instead of remembering what each dot means on the map.

## 6 DISCUSSION

### 6.1 VizProg’s Visualization is Intuitive for Participants

As our findings show, VizProg helps participants to identify more issues while spending less time analyzing students’ submissions. These findings suggest that VizProg’s visualization and interactions are intuitive compared to an enhanced version of OverCode, and can help them identify students’ problems at scale. One participant commented “...I would say initially, the whole movement from left to right is basically telling me the progress the student is making towards the right answer, whereas in Overcode it was more like just a set of blocks, and there was no indication whether the final one is the right or not...” (P1). This makes sense because the 2D map can off load users’ effort of tracking students’ history activities to visual information such as the color and the position of the dots. With the encoded information, users can more quickly decide on which students to focus on, shaping their strategies on analyzing students’ behaviors. Additionally, VizProg’s features— most notably, the ability to brush to select a group of students and examine progress at different levels (i.e., group level, individual level)—allowed participants to analyze student behaviors at scale with fewer context switches.

### 6.2 Trajectories in VizProg ease the reasoning progress

<a id="page-14"></a>

VizProg offers an innovative way to visualize students’ coding progress, which not only reduces instructor’s memory load, but also provides a clear visual guide to reasoning about students’ behaviors. For instance, when students are working toward a final solution, instructors can clearly see how a dot moves along a trajectory and easily recall history versions by looking at trajectory’s position. In a conventional timeline view, every time students make a new submission, users need to look at previous versions to recall what this student submitted before. Additionally, VizProg also helps participants identify abnormal behaviors. For instance, participants found that some students’ trajectories first reached the rightmost side and then wander back to the left side of the map, which means the students had correct submissions and then changed it to incorrect solutions. They reasoned that these students might be exploring other approaches and did not need help. Participants also found that students were wandering in the middle of the map and never reached the right side of it during the whole exercise. Participants then decided to talk to the student and give tailored feedback.

### 6.3 The Student Experience with VizProg

Beyond helping instructors, VizProg might also benefit to students in several ways. Most directly, by helping instructors identify struggling students and class-wide patterns, VizProg allows instructors to adapt their instruction to students’ needs. For example, instructors might discuss mistakes that they observed across many students, give students tailored feedback, or create impromptu in-class exercises in response to what observe in VizProg. Future versions of VizProg could incorporate additional student information[3](<#page-14>) that might help instructors better understand if there might be class-wide equity issues (e.g., if there are hidden barriers that prevent a group of people from being able to meaningfully participate in class exercises). Future versions of VizProg could also help to increase student engagement and improve the effectiveness of peer learning. Prior work found that in peer learning, students are grouped without regard to their diverse backgrounds, solution approaches, and levels of knowledge, which could lead to less meaningful and less fruitful group discussions \[[38](<#page-16>)\]. By encoding students’ progress into a 2D map, VizProg can help instructors connect students with each other strategically—for example, to form groups of students who took different approaches or to pair students who are struggling with peers that can help them. Third, Denny et al. \[[8](<#page-15>)\] found that students benefit from exposure to a wider diversity of solutions by reviewing others’ code. With the assistance of VizProg, instructors could easily guide students to diverse solutions from other students without revealing their identities, thus giving students a deeper understanding of how they can apply the concepts they learn in class.

### 6.4 Ethical Implications and Privacy in VizProg

VizProg provides a code-centered view, where instructors can focus on the code itself without sensitive information such as students’ names, genders, grades, or race. Given sensitive information such as identities, instructor may stereotype some groups of students. Inequities embedded in and around computing courses can be barriers to participation and promote bias in class \[[24](<#page-15>), [30](<#page-15>)\]. Therefore, the code-centered view in VizProg could potentially reduce bias and help create a fairer environment for students. Future deployments of VizProg should also give students the option to opt out of sharing their data. The current VizProg interface allows instructors to monitor students’ progress in real-time without regard to students’ consent to submit. This could harm students’ privacy and make students less motivated to engage in class due to social pressure. We can extend VizProg at the student side to give students the option to turn monitoring mode on and off. In addition, students should be aware of being monitored when working on programming exercises in class. VizProg can be extended with an in-editor notification to inform them that they are being passively monitored by the instructor.

> <sup>3</sup>The design and presentation of this information would need to be considered carefully, as including demographic information might have important drawbacks, as we discuss in section [6.4.](<#page-14>)

## 7 LIMITATIONS

Our user study has three primary limitations. First, although we used authentic student data, we used a simulated setting rather than a real classroom. As a result, we removed distractions and psychological intensity for participants is reduced as compared to a live classroom setting. Second, the feedback generated by instructors was not forwarded to actual students, which might make participants less inclined to provide timely and nuanced feedback during the study. Third, we evaluated on relatively short snippets of code. More advanced programming courses might have exercises that require writing dozens of lines of code across multiple files, which could be more difficult to map and visualize or might require visualizing individual components separately. Additionally, there are limitations to the system. Several participants noted that both the baseline map as well as the 2D Euclidean map in VizProg can be overwhelming when many students are editing the code simultaneously. Although our results showed that participants were still able to find the information they needed quickly in VizProg, conveying high volume of information is still challenging using a 2D visualization.

## 8 FUTURE WORK

Beyond what we created and demonstrated in this work, VizProg has the potential to better capture and represent the process of solving exercises at scale and for instructors to precisely analyze behavior with lower cognitive effort. In this work, our target audiences are instructors of large introductory level programming courses, who need more efficient and intuitive support to understand students’ progress and misconceptions. But we believe that our approach can be generalized to many contexts that need to visualize progress changes at scale in real time. For example, the high level idea of visualizing incremental changes on a 2D map can be applied to monitoring students writing short-answer questions, identifying the spread of viruses, or analyzing spatio-temporal traffic flows \[9\].

<a id="page-15"></a>

In this work, VizProg updates the visualization upon each student keystroke, where the dots move in real-time as students type. We chose keystroke-level updates because it reveals more information than the granularity of every time students execute their code. In programming exercises, students have different coding habits and execute code at varying frequencies. Some students run code very often, while others run code only when they are ready to submit it. Instructors may not be able to observe the full process of how students develop a solution from scratch at the granularity of each execution of code. Nevertheless, as participants reported in the user studies, keystroke-level updates can be overwhelming and distracting especially when a bunch of dots move at the same time. Future work can explore different granularities of updates, such as every time students run the code or every few minutes. Additionally, we can explore various encoding models to reduce large spatial “jumps” between updates. We can also explore visualizing trajectories with color cues to help instructor better identify behavior patterns, such as jumping between different approaches and being stuck at a certain area.

## 9 CONCLUSION

In this work, we explored a design that allows instructors to visualize and understand students’ status in real-time for in-class programming exercises. We introduce VizProg, a tool that allows instructors to monitor and inspect large numbers of students’ coding submissions over time by presenting students on a 2D map. In VizProg, students’ status is represented as a position that encodes similarities in students’ code, how students approach the exercise, students’ progress—how close they are to a correct solution, and how students’ status changes over time. Our comparison study showed that VizProg can help participants to discover more than twice as many student problems, and find these problems with less than half of the time and fewer interactions. Furthermore, participants reported that VizProg provides richer and more comprehensive information for identifying important student behavior. This work illustrates how we can further improve teaching by better understanding students’ mental models and providing tailored feedback at scale.

## ACKNOWLEDGMENTS

This material is based upon work supported by the National Science Foundation under DUE 1915515.

## REFERENCES

- \[1\] Douglas S Blank, David Bourgin, Alexander Brown, Matthias Bussonnier, Jonathan Frederic, Brian Granger, Thomas L Griffiths, Jessica Hamrick, Kyle Kelley, M Pacer, et al. 2019. nbgrader: A tool for creating and grading assignments in the Jupyter Notebook. The Journal of Open Source Education 2, 11 (2019).

- \[2\] Marcel Borowski, Johannes Zagermann, Clemens N Klokmose, Harald Reiterer, and Roman Rädle. 2020. Exploring the Benefits and Barriers of Using Computational Notebooks for Collaborative Programming Assignments. In Proceedings of the 51st ACM Technical Symposium on Computer Science Education. 468–474.

- \[3\] Jeongmin Byun, Jungkook Park, and Alice Oh. 2021. Cocode: Providing Social Presence with Co-learner Screen Sharing in Online Programming Classes. Proceedings of the ACM on Human-Computer Interaction 5, CSCW2 (2021), 1–28.

- \[4\] Charles H Chen and Philip J Guo. 2019. Improv: Teaching programming at scale via live coding. In Proceedings of the Sixth (2019) ACM Conference on Learning@ Scale. 1–10.

- \[5\] Lijia Chen, Pingping Chen, and Zhijian Lin. 2020. Artificial intelligence in education: A review. Ieee Access 8 (2020), 75264–75278.

- \[6\] Yan Chen, Walter S Lasecki, and Tao Dong. 2021. Towards supporting programming education at scale via live streaming. Proceedings of the ACM on Human-Computer Interaction 4, CSCW3 (2021), 1–19.

- \[7\] Albert T Corbett and Akshat Bhatnagar. 1997. Student modeling in the ACT programming tutor: Adjusting a procedural learning model with declarative knowledge. In User modeling. Springer, 243–254.

- \[8\] Paul Denny, Andrew Luxton-Reilly, Ewan Tempero, and Jacob Hendrickx. 2011. Codewrite: supporting student-driven practice of java. In Proceedings of the 42nd ACM technical symposium on Computer science education. 471–476.

- \[9\] Somayeh Dodge and Evgeny Noi. 2021. Mapping trajectories and flows: facilitating a human-centered approach to movement data analytics. Cartography and Geographic Information Science 48, 4 (2021), 353–375.

- \[10\] Matthew L Egizii, James Denny, Kimberly A Neuendorf, Paul D Skalski, and Rachel Campbell. 2012. Which way did he go? Directionality of film character and camera movement and subsequent spectator interpretation. In International Communication Association conference, Phoenix, AZ.

- \[11\] Zhangyin Feng, Daya Guo, Duyu Tang, Nan Duan, Xiaocheng Feng, Ming Gong, Linjun Shou, Bing Qin, Ting Liu, Daxin Jiang, et al. 2020. Codebert: A pre-trained model for programming and natural languages. arXiv preprint arXiv:2002.08155 (2020).

- \[12\] Takanori Fujiwara, Jia-Kai Chou, Shilpika Shilpika, Panpan Xu, Liu Ren, and Kwan-Liu Ma. 2019. An incremental dimensionality reduction method for visualizing streaming multidimensional data. IEEE transactions on visualization and computer graphics 26, 1 (2019), 418–428.

- \[13\] Elena L Glassman, Lyla Fischer, Jeremy Scott, and Robert C Miller. 2015. Foobaz: Variable name feedback for student code at scale. In Proceedings of the 28th Annual ACM Symposium on User Interface Software &amp; Technology. 609–617.

- \[14\] Elena L Glassman, Jeremy Scott, Rishabh Singh, Philip J Guo, and Robert C Miller. 2015. OverCode: Visualizing variation in student solutions to programming problems at scale. ACM Transactions on Computer-Human Interaction (TOCHI) 22, 2 (2015), 1–35.

- \[15\] Ashok K Goel and Lalith Polepeddi. 2018. Jill Watson: A virtual teaching assistant for online education. In Learning engineering for online education. Routledge, 120–143.

- \[16\] Philip J Guo. 2015. Codeopticon: Real-time, one-to-many human tutoring for computer programming. In Proceedings of the 28th Annual ACM Symposium on User Interface Software &amp; Technology. 599–608.

- \[17\] Philip J Guo, Jeffery White, and Renan Zanelatto. 2015. Codechella: Multi-user program visualizations for real-time tutoring and collaborative learning. In 2015 IEEE Symposium on Visual Languages and Human-Centric Computing (VL/HCC). IEEE, 79–87.

- \[18\] Andrew Head, Elena Glassman, Gustavo Soares, Ryo Suzuki, Lucas Figueredo, Loris D’Antoni, and Björn Hartmann. 2017. Writing reusable code feedback at scale with mixed-initiative program synthesis. In Proceedings of the Fourth (2017) ACM Conference on Learning@ Scale. 89–98.

- \[19\] Jonathan Huang, Chris Piech, Andy Nguyen, and Leonidas Guibas. 2013. Syntactic and functional variability of a million code submissions in a machine learning mooc. In AIED 2013 Workshops Proceedings Volume, Vol. 25. Citeseer.

- \[20\] Shalini Kaleeswaran, Anirudh Santhiar, Aditya Kanade, and Sumit Gulwani. 2016. Semi-supervised verified feedback generation. In Proceedings of the 2016 24th ACM SIGSOFT International Symposium on Foundations of Software Engineering. 739–750.

- \[21\] Juho Kim, Elena L Glassman, Andrés Monroy-Hernández, and Meredith Ringel Morris. 2015. RIMES: Embedding interactive multimedia exercises in lecture videos. In Proceedings of the 33rd annual ACM conference on human factors in computing systems. 1535–1544.

- \[22\] Vladimir I Levenshtein et al. 1966. Binary codes capable of correcting deletions, insertions, and reversals. In Soviet physics doklady, Vol. 10. Soviet Union, 707–710.

- \[23\] Julia M Markel and Philip J Guo. 2021. Inside the Mind of a CS Undergraduate TA: A Firsthand Account of Undergraduate Peer Tutoring in Computer Labs. In Proceedings of the 52nd ACM Technical Symposium on Computer Science Education. 502–508.

- \[24\] Paola Medel and Vahab Pournaghshband. 2017. Eliminating gender bias in computer science education materials. In Proceedings of the 2017 ACM SIGCSE technical symposium on computer science education. 411–416.

- \[25\] Joseph Bahman Moghadam, Rohan Roy Choudhury, HeZheng Yin, and Armando Fox. 2015. AutoStyle: Toward coding style feedback at scale. In Proceedings of the Second (2015) ACM Conference on Learning@ Scale. 261–266.

- \[26\] Andy Nguyen, Christopher Piech, Jonathan Huang, and Leonidas Guibas. 2014. Codewebs: scalable homework search for massive open online programming courses. In Proceedings of the 23rd international conference on World wide web. 491–502.

- \[27\] Thanaporn Patikorn and Neil T Heffernan. 2020. Effectiveness of crowd-sourcing on-demand assistance from teachers in online learning platforms. In Proceedings of the Seventh ACM Conference on Learning@ Scale. 115–124.

- \[28\] Chris Piech, Jonathan Huang, Andy Nguyen, Mike Phulsuksombati, Mehran Sahami, and Leonidas Guibas. 2015. Learning program embeddings to propagate feedback on student code. In International conference on machine Learning. PMLR, 1093–1102.

- \[29\] Roman Rädle, Midas Nouwens, Kristian Antonsen, James R Eagan, and Clemens N Klokmose. 2017. Codestrates: Literate computing with webstrates. In Proceedings of the 30th Annual ACM Symposium on User Interface Software and Technology. 715–725.

- \[30\] Kevin Robinson, Keyarash Jahanian, and Justin Reich. 2018. Using online practice spaces to investigate challenges in enacting principles of equitable computer science teaching. In Proceedings of the 49th ACM Technical Symposium on Computer Science Education. 882–887.

- \[31\] Saul Schleimer, Daniel S Wilkerson, and Alex Aiken. 2003. Winnowing: local algorithms for document fingerprinting. In Proceedings of the 2003 ACM SIGMOD international conference on Management of data. 76–85.

- \[32\] Gursimran Singh, Shashank Srikant, and Varun Aggarwal. 2016. Question independent grading using machine learning: The case of computer program grading. In Proceedings of the 22nd ACM SIGKDD International Conference on Knowledge Discovery and Data Mining. 263–272.

- \[33\] Rishabh Singh, Sumit Gulwani, and Armando Solar-Lezama. 2013. Automated feedback generation for introductory programming assignments. In Proceedings of the 34th ACM SIGPLAN conference on Programming language design and implementation. 15–26.

<a id="page-16"></a>

- \[34\] Ahmad Taherkhani, Ari Korhonen, and Lauri Malmi. 2012. Automatic recognition of students’ sorting algorithm implementations in a data structures and algorithms course. In Proceedings of the 12th Koli Calling International Conference on Computing Education Research. 83–92.

- \[35\] Ahmad Taherkhani and Lauri Malmi. 2013. Beacon-and Schema-Based Method for Recognizing Algorithms from Students’ Source Code. Journal of Educational Data Mining 5, 2 (2013), 69–101.

- \[36\] Yuta Taniguchi, Tsubasa Minematsu, Fumiya Okubo, and Atsushi Shimada. 2022. Visualizing Source-Code Evolution for Understanding Class-Wide Programming Processes. Sustainability 14, 13 (2022), 8084.

- \[37\] Laurens Van der Maaten and Geoffrey Hinton. 2008. Visualizing data using t-SNE. Journal of machine learning research 9, 11 (2008).

- \[38\] April Yi Wang, Yan Chen, John Joon Young Chung, Christopher Brooks, and Steve Oney. 2021. PuzzleMe: Leveraging Peer Assessment for In-Class Programming Exercises. Proceedings of the ACM on Human-Computer Interaction 5, CSCW2 (2021), 1–24.

- \[39\] Daniel Weitekamp, Erik Harpstead, and Ken R Koedinger. 2020. An interaction design for machine teaching to develop AI tutors. In Proceedings of the 2020 CHI conference on human factors in computing systems. 1–11.

- \[40\] Joseph Jay Williams, Juho Kim, Anna Rafferty, Samuel Maldonado, Krzysztof Z Gajos, Walter S Lasecki, and Neil Heffernan. 2016. Axis: Generating explanations at scale with learnersourcing and machine learning. In Proceedings of the Third (2016) ACM Conference on Learning@ Scale. 379–388.